 en
en br
brFBMonLogger
FBMonLogger is a part of HQbird Standard now!
FBMonLogger is a tool to analyse monitoring tables output in Firebird and find problems with slow SQL queries, wrongly designed transactions (long-running transactions, transactions with incorrect isolation level, etc) and identify problematic applications.
FBMonLogger can connect to Firebird database with performance problems and identify what is the reason of slowness: is it some user attachment, slow SQL query or long-running transaction?
FBMonLogger supports Firebird 2.1, 2.5 and 3.0 – for older Firebird versions or InterBase please use FBScanner.
FBMonLogger can show you:
- Top attachments with highest number of IO operations, non-indexed and indexed reads
- Top SQL statements with highest number of IO operations, non-indexed and indexed reads
- Problematic transactyions: long-running transactions, transactions with erroneous isolation level, read/write transactions, and related information: when they started, what applications started these transactions, from what IP address, etc
- Attachments and statements with the most intensive garbage collection actions
- Read/write ratio, INSERTS/UPDATE/DELETE ratio, and more.
After connection to the database where you want to find performance problems, several snapshots of monitoring tables should be done – click on «Get Snapshot» to take snapshot.
Aggregated performance statistics for users attachments
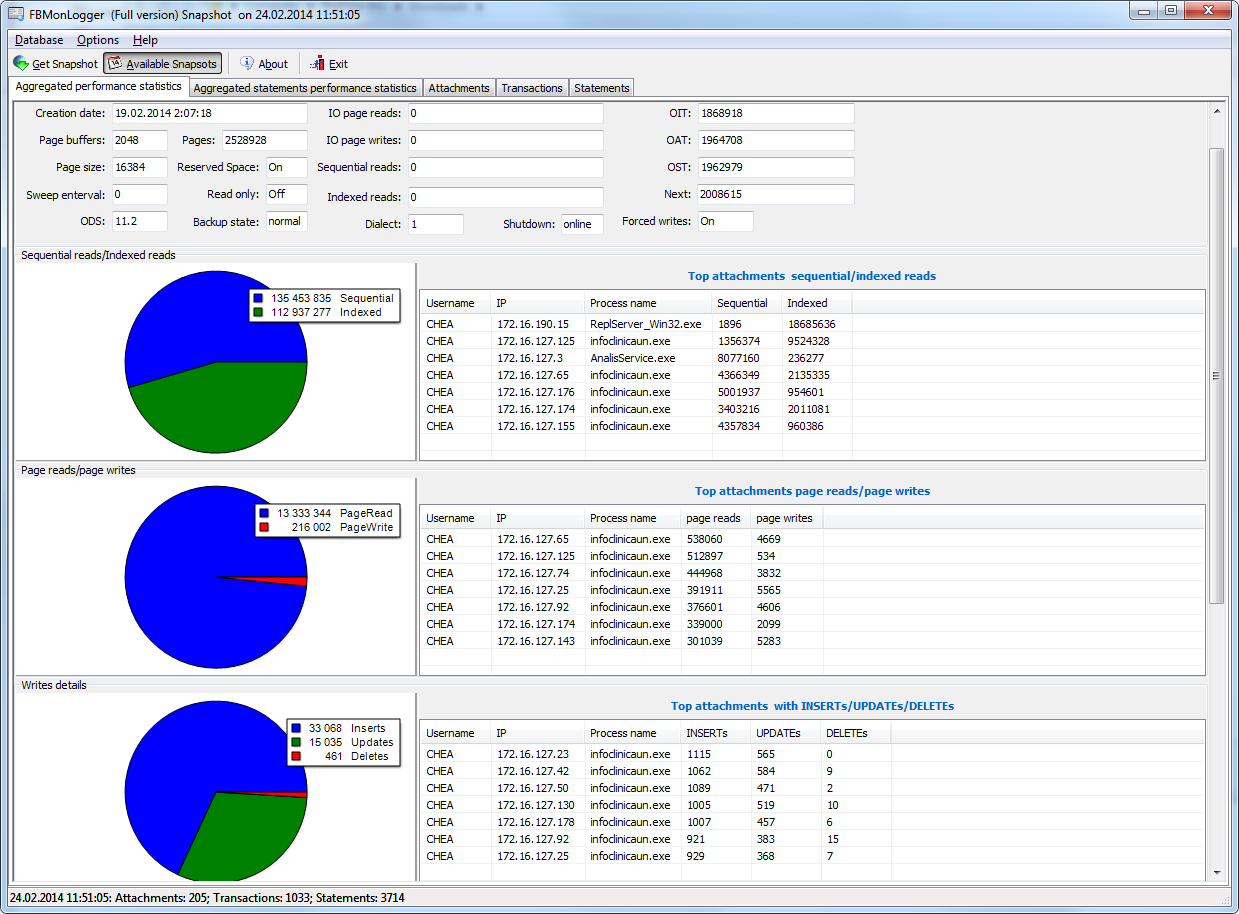
At the first screen we can see aggregated statistics for database connections, and identify connections with the biggest problems:
Sequential reads / Indexed reads
"Sequential reads / Indexed reads" shows us total ratio between sequential (non-indexed) reads and indexed reads in application. Usually number of non-indexed reads should be low, so big percent of sequential reads is sign that many SQL queries have NATURAL execution plans, and they could be a reason of slow response time.
Click on record in «TOP attachments: sequential/indexed reads» will bring you to tab «Attachments», where you can see more details about Attachment, and then jump to tab «Transactions» or «Statements», where you will see transactions and attachments linked with selected attachment (if checkmark «Link to selected attachment» is on, otherwise all transactions/statements for all attachments will be shown).
Write details
«Write details» gives you an overview of write operations: ratio between INSERTs/UPDATEs/DELETEs among all database attachments. In the table of top writers you can see attachments with the biggest number of write operations. It is useful to identify applications or software modules which performs excessive number of update or deletes (which are the most dangerous operations in terms of garbage collections).
Garbage collection details
What garbage collection operations mean?
- Purge – engine removes backversions, only primary version is in database.
- Expunge – both primary version and all backversions were deleted.
- Backout – remove only primary version (due to rollback).
Usually we can associate purge with UPDATE operation, Expunge with DELETE, and Backout with rollback of INSERT or UPDATE. Many backouts could mean that there is a problem with transaction management in the application.
Memory usage
«Memory usage» graph shows us total memory used by all active attachments now, and peak of allocated memory for them in the past.
List of top attachments by memory usage shows us the biggest memory consumers among your attachments. It is useful to find applications or software modules with excessive memory usage.
Aggregated performance statistics for statements
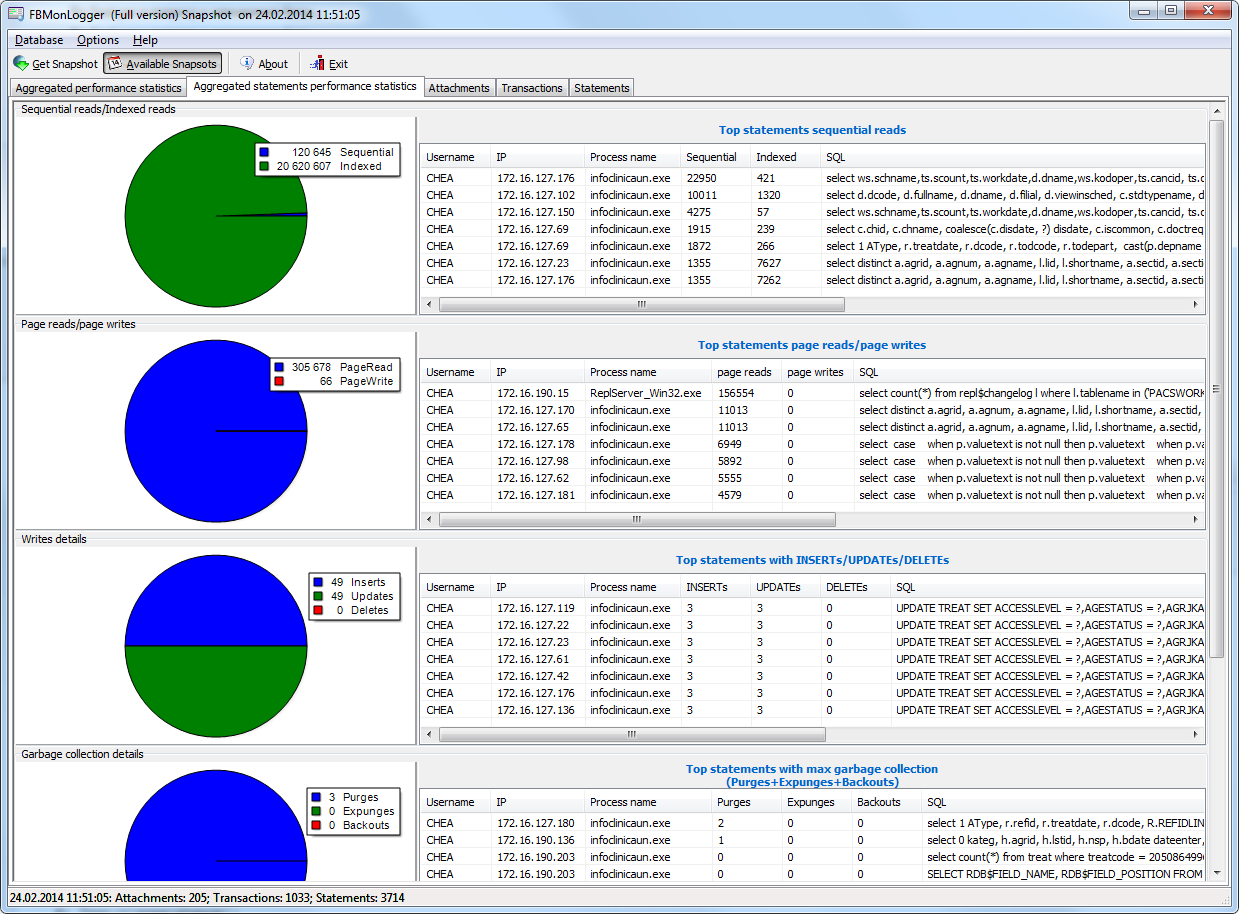
At the second tab you can find aggregated performance statistics for statements. This statistics better reflects the momentary situation in the database – since monitoring tables collect information since the beginning of each object life, statements you can see here are those which were running during the moment when snapshot was taken.
Sequential reads / Indexed reads
In this list we can see top statements which perform many sequential reads from the database. Usually such statements require SQL tuning – either through indices tuning, or through SQL query redesign.
To tune the query, check its execution plan: usually it is possible to improve query speed by eliminating NATURAL in plans with new indices or query redesign. Click on the statement in this list to open tab «Statements», where you can find more details about selected statement, and jump to associated transaction or attachment.
Page reads/page writes
This graphs and list shows brief information about top statements which perform many reads – it means that they consume significant IO and can affect performance of other queries. SQL statements with peak values should be carefully checked for optimal performance.
Write details for statements
At this graph you can see what writing SQL statements were doing at the moment when snapshot of monitoring tables was taken, and identify UPDATES and DELETEs which made many changes in the database
Garbage collection details for statements
At this graph we can see how many garbage collection operations were done by statements running at the moment of snapshot.
Memory usage for statements
Unlike aggregated memory usage statistics for attachment, statements' memory usage can show us list of exact statements which consume a lot of memory at the moment.
Attachments
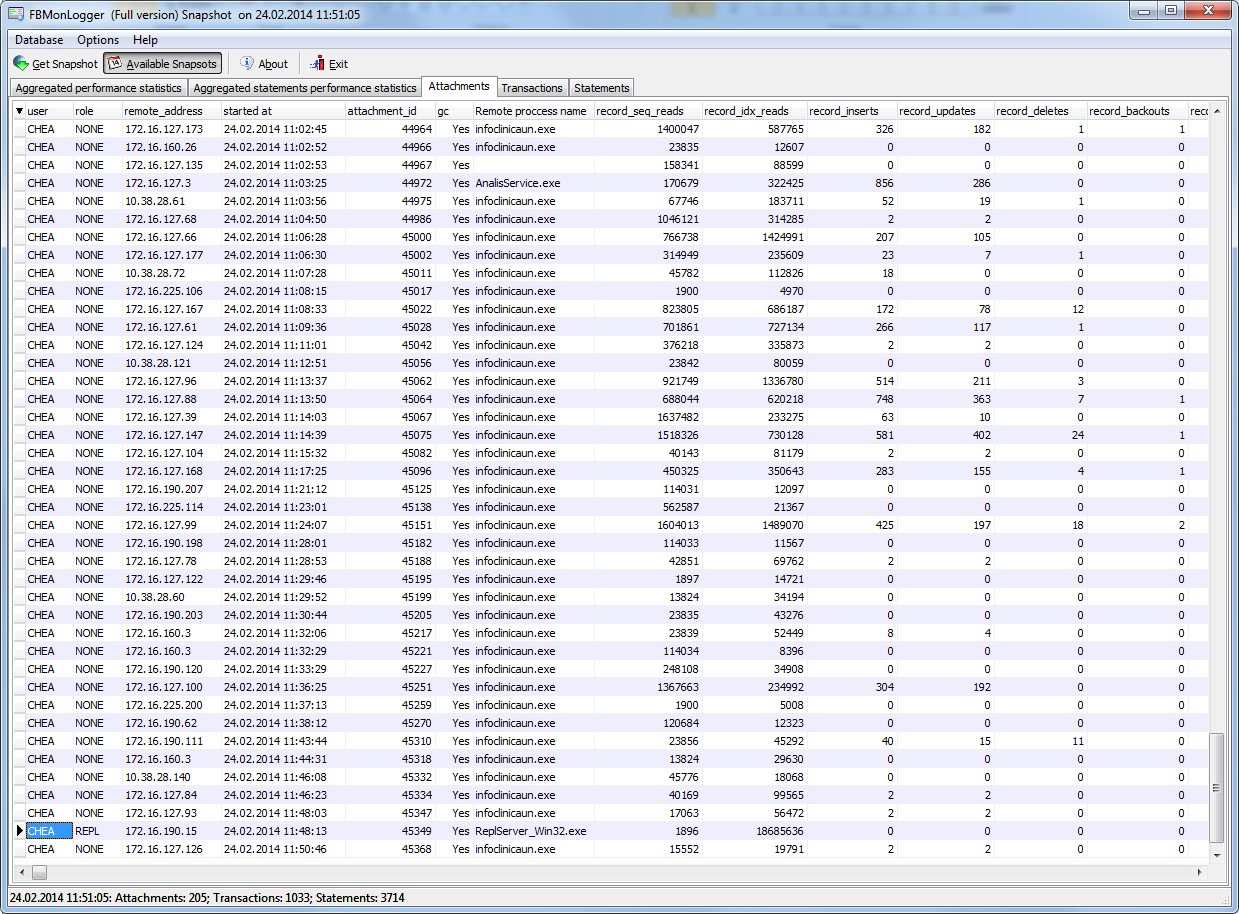
The third tab is «Attachments». You can open this tab directly to jump there by clicking one of the records at «Aggregated performance statistics».
Attachments shows list of users connected to the Firebird database, with many useful details: USER and ROLE of attachment, start time and ID of attachment, is there garbage collection enabled for the attachment, name of remote process which established an attachment, and several accumulated performance counters for the attachment: number of sequential reads [done by attachment since its start], number of indexed reads, number of inserts, updates and deletes, as well records backouts, purges and expunges.
By default some of columns of attachment are switched off, to show only most important information.
Of course, every time you click on attachment, you can jump to transactions running inside it, and then to statements. There is a checkbox in the left upper corner of Transactions and Statements tabs, which controls the behaviour – when checked, only transactions and statements marked by selected attachment ID, will be shown.
Transactions
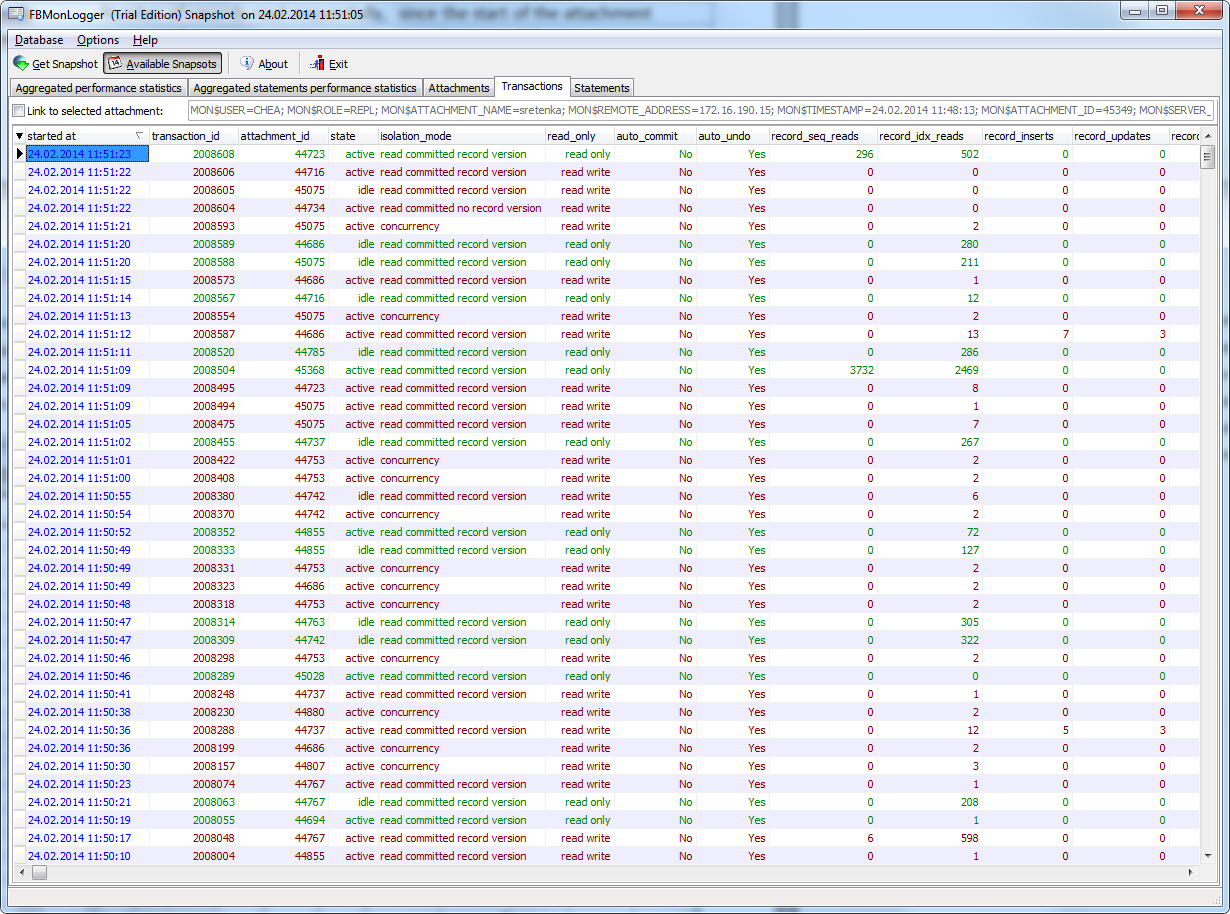
Tab «Transactions» shows active transactions at the moment when snapshot was taken. If checkbox «Link to selected attachment» is enabled, only transactions for selected attachment will be shown, otherwise all transactions are shown.
One of the most important characteristics is a lifetime of transactions: since Firebird is designed to work with short write transactions, it is important to keep them as short as possible. FBMonLogger highlights transactions with isolation modes and read-write settings which hold Oldest Active transaction and therefore provoke excessive record versions to be not cleared. If you see such transaction and it started a while ago, it means that it can be responsible for excessive records versions.
Sort on «started at» column and look for old transactions, marked in red: all writeable transactions and read only snapshots stuck Oldest Active Transaction and provoke excessive record versions to be hold. Identify where these transactions started (right-click and select «View parent attachment») and fix your code to commit this transaction earlier.
Statements
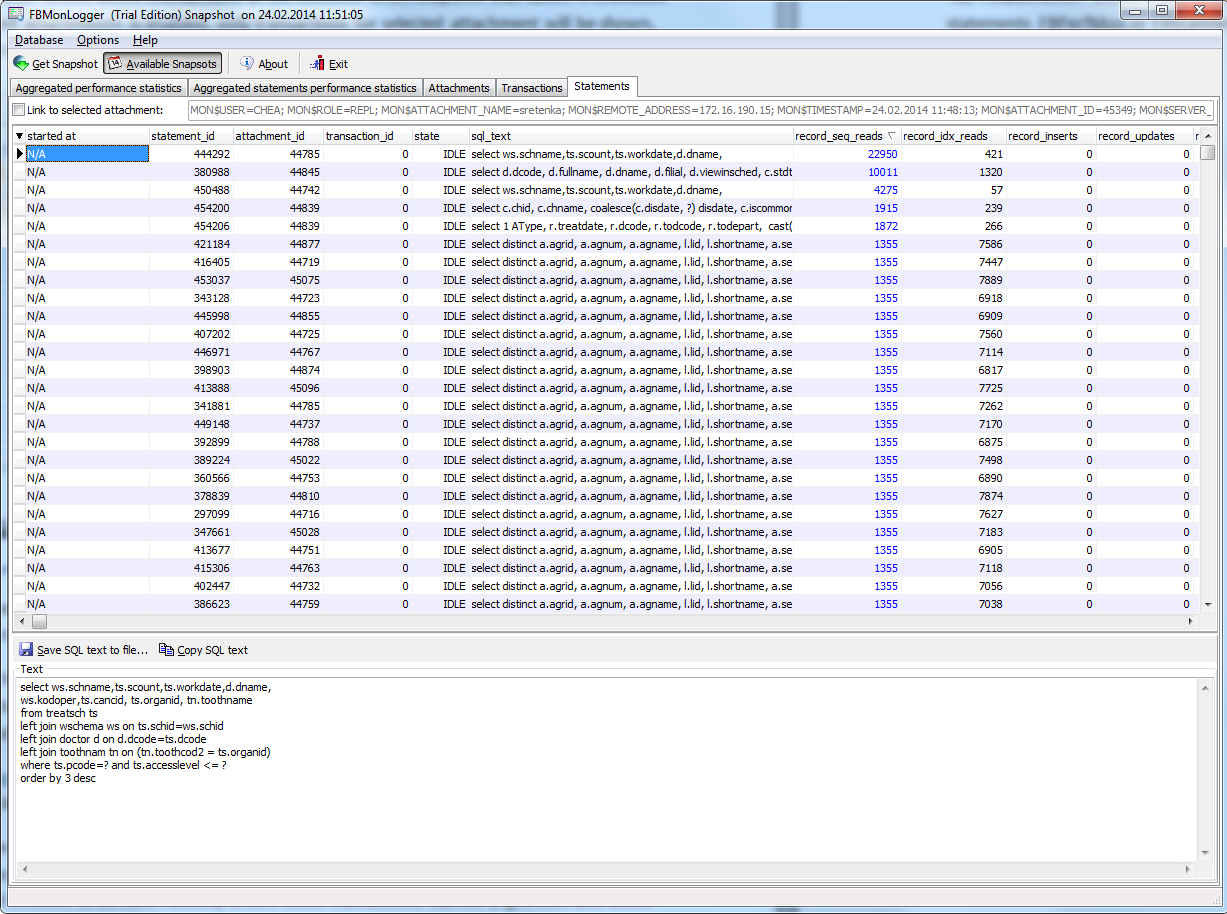
Tab «Statements» shows statements active at the moment of snapshot: if you need to catch all statements FBPerfMon or FBScanner should be used (all these tools are part of IBSurgeon Optimization Pack).
If «Link to selected attachment» is enabled, only statements for specific attachment will be shown, otherwise all active statements are in the list.
Some statements have no associated transaction id (=0): these queries are prepared, but not executed.