Monitoring in HQbird
HQbird gives you two ways to see what Firebird is doing: Advanced Monitoring for per-minute graphs and live detail, and Performance Trace Reports for deeper analysis of slow and frequent SQL. Both run on the server; Advanced Monitoring can also feed HQCenter.
Two monitoring approaches
Advanced Monitoring
Continuous collection from Trace API, MON$, lock table, transactions, CPU, and RAM - shown as per-minute graphs with detail for every minute. Data appears after 1-2 minutes of processing, locally on port 8083, and optionally in HQCenter.
How to use itPerformance Trace Report
Scheduled in-depth analysis of trace logs (for example over a working day). Use it for statistical impact of very frequent queries, long queries, and similar patterns. Also available for vanilla Firebird on some calculator subscriptions.
How to set it up1. Advanced Monitoring
Open the HQbird web UI on port 8083 (for example http://localhost:8083) with the same username and password as the main interface.
Graphs cover IO, load, queries, host CPU/RAM, transactions, and the lock table. Each minute also records top SQL, long-running transactions, and client processes. Full metric list: HQCenter overview.
Watch the video for setup and a walkthrough of the per-minute view.
2. Performance Trace Reports
HQbird can collect performance traces on a schedule to find slow, frequent, or otherwise costly SQL. Setup takes less than a minute. If you run vanilla Firebird instead, follow this instruction.
Enable server-level trace
In the main UI (localhost:8082), open the Performance tab on the left and choose HQbird server level trace (configuration icon) to cover all databases on the server.

Mandatory settings

- Enable performance monitoring - must be on for scheduled traces.
- Start trace session at / Stop trace session - CRON expressions. Default is 10:30-11:00; change this to match your load.
- SQLs duration limit - log queries slower than this (milliseconds). Default is 1000 ms. Start at 50 ms, then try 1 ms and 0 ms on later days. Go back to 50 ms if traces grow too large (for example more than 5 GB per day).
- Send email - emails the report using the addresses from Alerts configuration.
Useful CRON schedules
| Start | End | What it does |
|---|---|---|
0 0 * ? * * |
0 10 * ? * * |
Every hour, minutes 0-10 |
0 0 8 ? * * |
0 0 17 ? * * |
Every day 08:00-17:00 |
0 30 10,13,15 ? * * |
0 0 11,14,16 ? * * |
Daily 10:30-11:00, 13:30-14:00, 15:30-16:00 |
Advanced parameters
You can leave these at defaults at first.

- Configuration template - trace configuration template file.
- Database filter - usually AUTO. Filename or Alias filters by those; Manual takes a regular expression (several databases or several aliases for one file).
- Database name filter - used with Manual.
- Trace format - AUTO, or force 2.5 / 3.0. Rarely needed.
- Keep recent reports - how many HTML reports to keep in the output folder.
Other fields are described in the HQbird User Guide.
The report
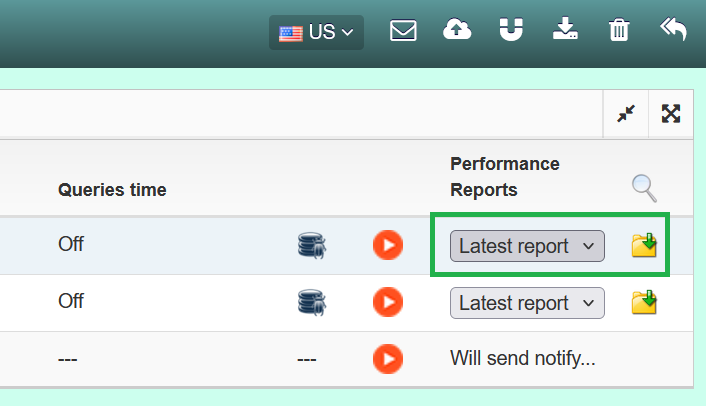
Each job writes an HTML file in the output folder and can email it. The newest report is also in the HQbird UI for viewing or download.
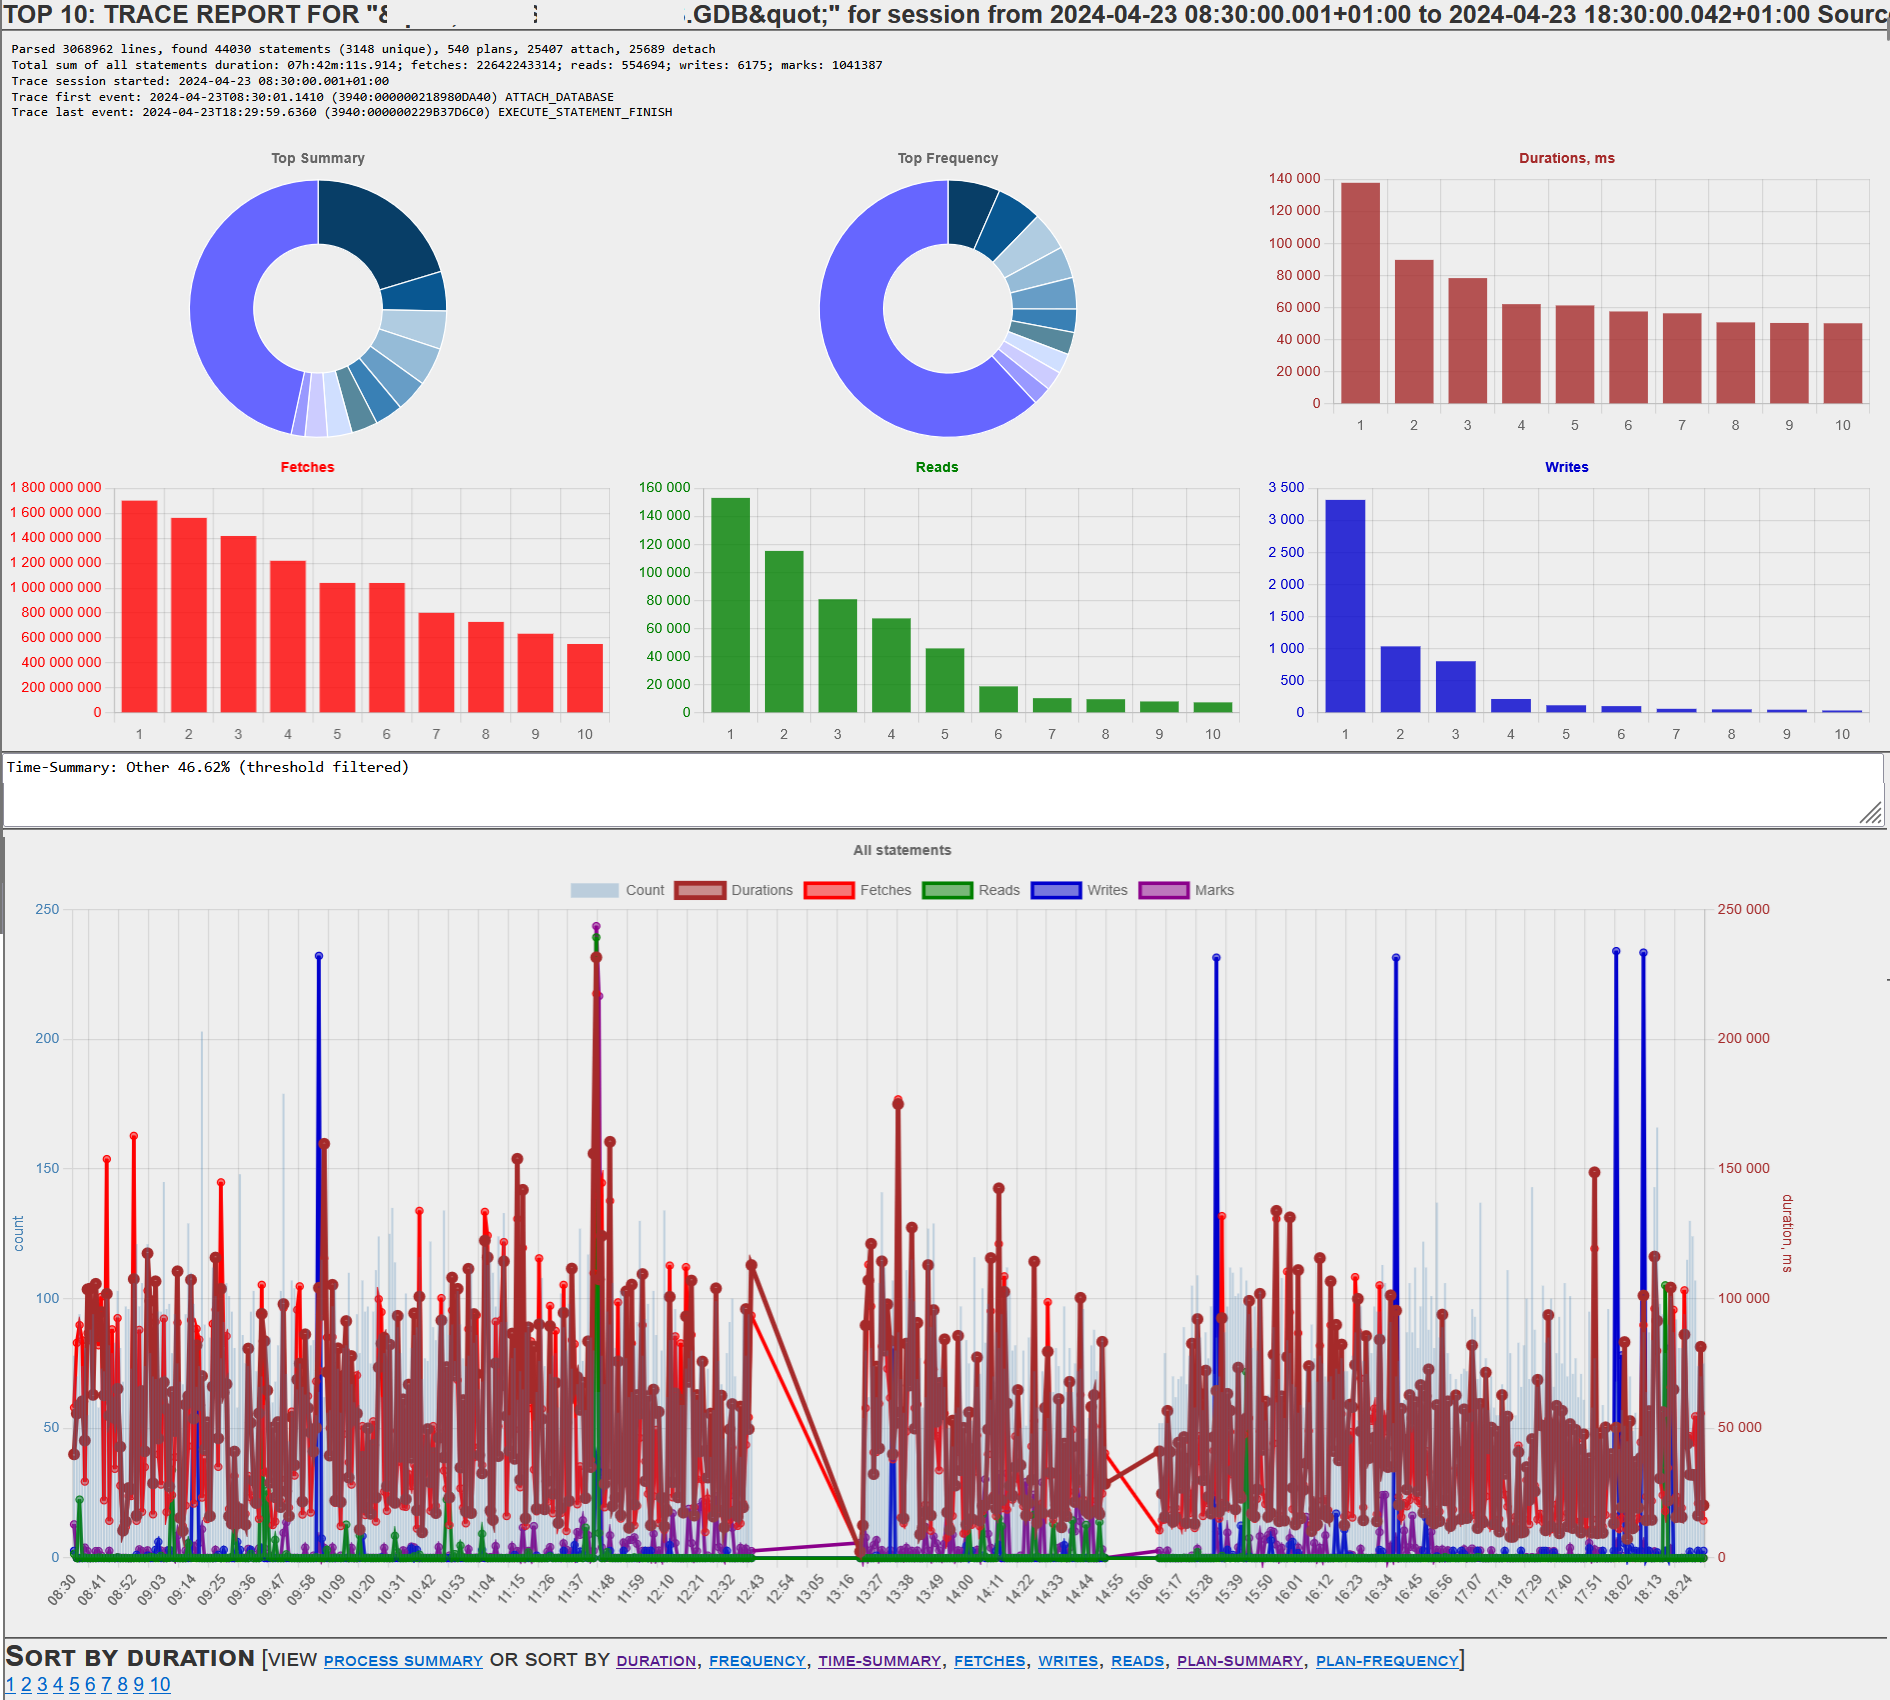
See the video below and the example of performance analysis for how to read the numbers.