HQbird Monitor User Guide
Console pages, investigation flow, screenshots and architecture diagrams for HQbird Monitor. Installers: HQbird 2027 Download. Also in Portuguese (BR).
This guide is for the people who use the HQ Monitor console: DBAs, support engineers and administrators. It shows every page of the console, explains what you see on it, and shows how to use the pages to find a problem.
HQ Monitor is a web console for Firebird servers. It does not connect to
Firebird. It shows the data that the HQbird agent (fbagent) collects on each
server: CPU and memory, connections, transactions, trace, logs, gstat
statistics and reports.
About the pictures. The pictures come from a working console (HQ Monitor 1.53.0, agents 2.99) with demo mode on (see Settings). Server, database and process names and paths in the pictures are made-up words of the same length as the real ones, for example
siserikoditobefikepebur. IP addresses start with 192.168. Secret values are hidden. In this text,SRVstands for a server name andemployeefor a database name.
Contents
- How HQ Monitor works
- Sign in and general controls
- Servers page
- Server dashboard
- Database pages
- Statistics: gstat reports and trends
- Server tools: Logs, Configs, Errors, Conflicts, Perf Report
- Server health report
- Agent configuration editor, Backups and Activity
- Licenses
- Administration: users and clusters
- Installation and settings for administrators
- Troubleshooting
1. How HQ Monitor works
Where the data comes from

- The agent collects the data on the Firebird server and writes it to files.
- In a collection center, the agents send their files through goafts.
The files arrive in the console’s data folder (
data_path), one folder per server. - Beside one agent (local install), the console reads the folder of that agent directly. See the local-install documentation shipped with the product.
- The console only reads files. It never connects to Firebird.
- Changes go the other way (dashed lines). In a collection center, a configuration change, a Run now request or a license goes to goafts. The agent takes it at its next sync, usually within a minute. In a local install the console gives these changes to the agent beside it directly.
The pages are the same in both kinds of install.
Page map

- The dashboard has two ways to the server health report:
- Server status in the time bar opens the report of the newest status snapshot in the time range;
- Report for this minute (under the selected minute) opens the report of the snapshot that covers that minute.
- Every server page has the same header menu: Logs, Configs, Errors, Conflicts, Perf Report, Jobs and Backups. See Header and breadcrumb line.
- The gear icon in the header opens Settings from every page.
A typical investigation

- Start on the Servers page. Look for a red or orange status.
- Open Report for that server. The findings tell you what the agent saw.
- Open the dashboard. Find the time of the problem on the charts.
- Click that point (see Select a minute). The charts mark that minute, and the tables of the open database rows show that minute.
- Open the database row. Read the heaviest queries and the connections of that minute.
- Go to the page that fits the problem.
2. Sign in and general controls
Sign in
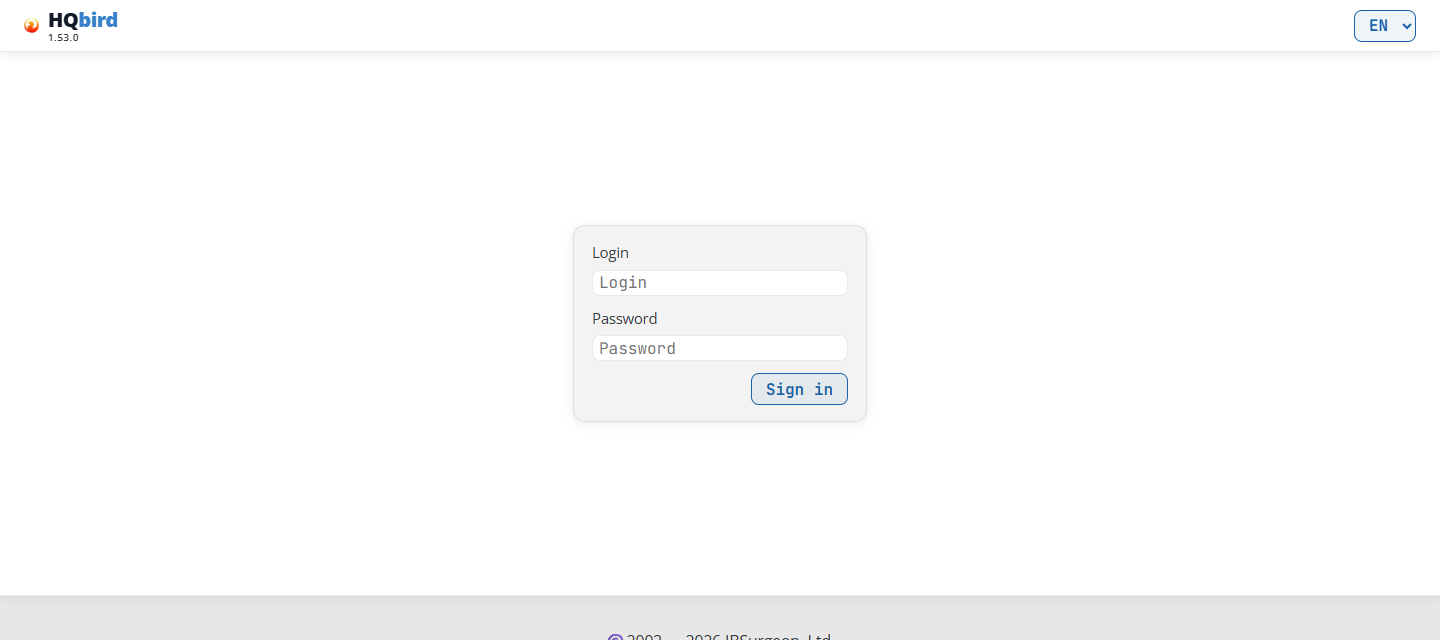
What you see
- The header: the HQbird logo with the console version under it (here
1.53.0), and the language list (EN) at the right. - The sign-in box: Login, Password and the Sign in button.
To sign in:
- Open the console address in a browser, for example
http://192.168.0.10:8080. Your administrator gives you the address and port. - Enter Login and Password, then click Sign in.
- The console opens the Servers page.
How the session works:
- The login name is not case-sensitive.
- A session lasts 7 days. After that, or after the console restarts, you sign in again.
- The browser keeps the session in a cookie named after the console’s port,
for example
fbmonitor_auth_8080. So two consoles on one host (on different ports) keep separate sessions. When you sign in to one, you stay signed in to the other. - Log out (top right corner of every page) ends all sessions of your login, in every browser. In single user mode there is only one login, so Log out signs out everyone who uses this console.
- When the password changes (on the Settings page or on the agent’s host), every other session ends. Those browsers sign in again.
- In multiple user mode (see Users), the console checks your account on every request. When an administrator deletes your account or gives it a new password, your sessions end.
Where the password comes from in single user mode: the console checks the
password that the local agent keeps, as a hash, in its agent_config.json
(fbagent 2.80.0 or newer). The agent writes it at setup and when it imports
FBDataGuard’s access.properties. Without it the console reads
access.properties as before.
If you sign in with a weak password in single mode, a line under the header
says Your password is weak, change it. A weak password is the FBDataGuard
default strong password, a password shorter than 7 characters, or one
without a letter or without a digit. The line links to Change password on
the Settings page. When the console cannot change the password, the line
names the command to run on the agent’s host instead:
fbagent --reset-hqmonitor-password.
Messages you may see
| Message | What it means |
|---|---|
| Invalid login or password | Wrong login or password. |
| Too many login attempts. Try again in 15 minutes | 8 failed tries from your address in 15 minutes. Wait, then try again. A successful sign-in resets the count. |
| access.properties is missing or cannot be read | Single user mode: the console found no password, neither in the agent’s agent_config.json nor in access.properties. Ask the administrator. |
| users.enc is missing or cannot be read | Multiple user mode: the user file is missing or damaged. Ask the administrator. |
Header and breadcrumb line
Every page after the sign-in has a header at the top. On a server page (the dashboard, the database pages, the server tools) it has, from left to right:
- The HQbird logo with the console version. On a release build, point at
the version to see the build number and build time, for example
build 128 · 2026-09-04 03:12 UTC. - ← Servers: returns to the Servers page.
- The server name. Click it to open the server dashboard.
- The menu: Logs, Configs, Errors, Conflicts, Perf Report, Jobs and Backups. The page you are on is highlighted. Jobs and Backups show only when the console can open the configuration editor for this server.
- At the right: the gear icon (Settings), Log out and the language list.
Other pages have a shorter header:
| Page | Header |
|---|---|
| Servers | Logo, gear icon, Log out, language. No ← Servers, no menu. |
| Licenses, User management, Clusters | Logo, ← Servers, gear icon, Log out, language. No server name, no menu. |
| Settings | The header of the last server page you opened in this browser tab, without the server name. |
| Configuration editor (Jobs, Backups, Activity) | The full server header. See chapter 9. |
The breadcrumb line. Under the header, a thin line shows where you are. It always starts with Servers. Click any step to go back to it. The last step is the page you are on. Examples:
Servers › SRV: the server dashboard;Servers › SRV › Logs: a server tool;Servers › SRV › employee › Statistics › Report: a database page;Servers › SRV › Jobs › Activity: the configuration editor;Servers › Licenses,Servers › Users › Add user,Servers › Settings: pages that are not about one server.
Point at a server or database step to see its full name. The Servers page and the sign-in page have no breadcrumb line.
Lines under the header. Below the breadcrumb line, the console can show these lines (not on the configuration editor pages):
- the red license line, when an agent stopped license jobs: “No license. Backups, restore, sweep, tracing, statistics and replication are stopped. The databases work.”;
- the yellow trial line, when a trial ends in 7 days or fewer: “Trial: 5 days left. To extend it to 30 days, enter a work email.”;
- the weak password line (single user mode only, see Sign in).
The license and trial lines name up to three servers and the link License page or Enter an email. See The license banner.
Language
Use the language list (EN) in the top right corner. It shows RU, EN, DE, PT and ES: Russian, English, German, Portuguese (Brazil) and Spanish.
- On the first visit the console uses the browser’s language, if it is in the list. Otherwise it uses English.
- The browser keeps your choice for one year (cookie
fbmonitor_lang). - Statistics reports also follow this language.
Settings (gear icon)
The gear icon opens Settings. Display density, color scheme and demo mode apply to this browser only. The page keeps the server name and the menu of the server you came from, so you can go back to it in one click.
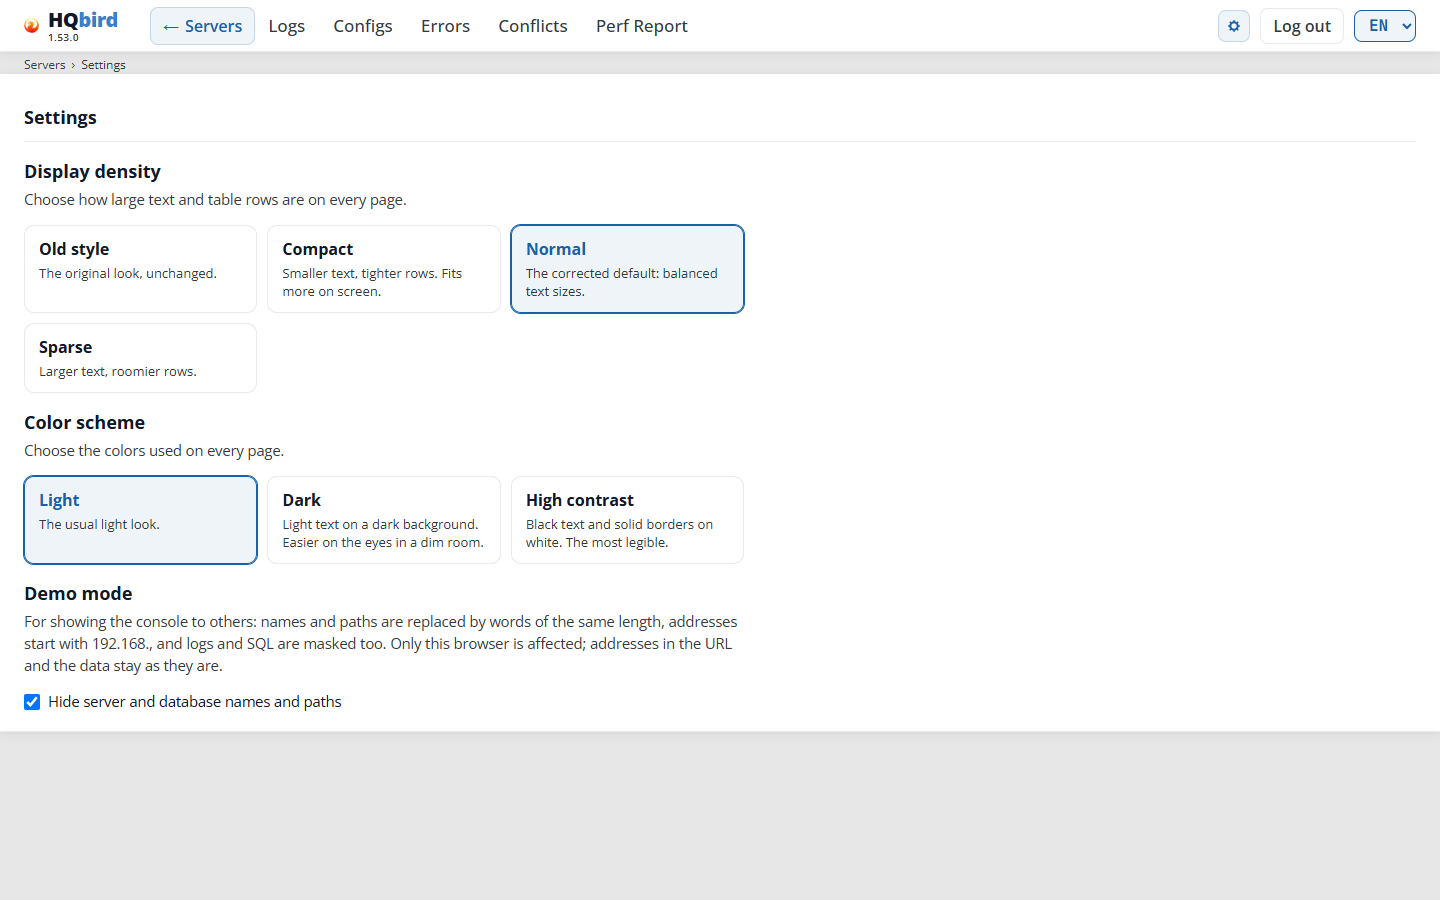
What you see
- The header of the last server page (without the server name) and the
breadcrumb line
Servers › Settings. - Display density: four choices, each with a short description.
- Color scheme: three choices.
- Demo mode: a description and the check box Hide server and database names and paths.
- Console password: only in single user mode, so it is not in the picture.
The selected choice has a blue frame. Every click is saved at once, and the console shows Saved for a moment. The browser keeps the density and the color scheme for one year. Demo mode stays on in this browser until you turn it off.
-
Display density: how large text and table rows are on every page.
- Old style: the original look.
- Compact: smaller text, tighter rows, more rows on the screen.
- Normal (default): balanced text sizes.
- Sparse: larger text and more space.
-
Color scheme: Light (default), Dark, High contrast (black text and solid borders on white).
-
Demo mode: Hide server and database names and paths. Use it when you show the console to other people.
- Server, database and process names and paths become made-up words of the same length.
- IP addresses start with
192.168.. - Logs and SQL text are masked too. Text values in SQL (in quotes) are replaced; table and column names stay.
- Free text is masked on every page: the AI summary, the health report, the configuration files, the license and cluster pages, the configuration editor and the statistics reports. Configuration keys stay as they are.
- The breadcrumb line shows the masked names.
- A form field shows the masked value but keeps the real one. A field that has a value cannot be edited while demo mode is on.
- The copy buttons for paths and SQL are hidden. The Export CSV button on the Errors page is hidden too.
- Only the screen changes. The browser address and the data stay as they are. The mode is off by default.
-
Console password (single user mode only): changes the password of the console’s login.
- Enter Current password.
- Enter New password and Repeat the new password: at least 7 characters, with letters and digits.
- Click Change password.
The agent stores the new password as a hash in its
agent_config.json. This needs fbagent 2.80.0 or newer on the same machine. Every other session is signed out. A wrong current password counts as a failed sign-in, with the same limit as on the sign-in page. The change is written to the audit log. When the console cannot change the password, the block says why; then runfbagent --reset-hqmonitor-passwordon the agent’s host.
Messages you may see (Console password)
| Message | What it means |
|---|---|
| Password changed. Other sessions are signed out. | Done. Use the new password from now on. |
| The current password is wrong. | Check Current password. |
| The two new passwords are different. | New password and Repeat the new password must be the same. |
| The new password is weak: use at least 7 characters with letters and digits. | Choose a longer password with letters and digits. |
| The new password is the current one. | Choose a different password. |
| The new password is empty. / The new password is too long. | Enter a password of a normal length. |
| Too many attempts. Try again later. | Too many failed tries from your address. Wait up to 15 minutes. |
| The password cannot be changed here: … | The console cannot change it (the reason follows). Run fbagent --reset-hqmonitor-password on the agent’s host. |
| The agent did not apply the new password; nothing was changed. | The agent refused the change. The old password still works. |
Time and time zone
- Server pages show time in the server’s time zone, not your browser’s.
A badge near the time controls shows the zone offset, for example
UTC+03:00. Hold the mouse over the badge to see the zone name. - The Servers page uses the time zone of the console machine. The clock at the right shows the current time in that zone. See Date and time range.
- Most pages have the same time controls:
- the date button (Choose date, then the chosen date) opens a calendar. Only days that have data can be selected. A calendar without data says No data;
- From and To set the time range inside that day, in one-minute steps. If From is not before To, To moves to one minute after From;
- the preset list sets a typical range. Selected becomes active when you set From and To by hand.
- A range never crosses midnight.
The presets work differently on each page:
| Page | Presets | Default | How a preset sets the range |
|---|---|---|---|
| Servers | Last 6h, Last 12h, Full day | Last 6h | Counts back from the clock for today, or from 23:59 for a past day. |
| Dashboard, Database, Metrics | Last 1h, Last 6h, Last 12h, Full day | Last 1h | Counts back from the last data point of the chosen day. |
| Logs | Full day, Last 1h, Last 6h, Last 12h | Full day | Last 1h ends at the newest entry. Last 6h is always 18:00–23:59, Last 12h is always 12:00–23:59. |
| Errors | Full day, Last 1h, Last 6h, Last 12h | Last 1h | Last 1h ends at the newest error of the day. Last 6h and Last 12h as on Logs. |
Conflicts, Perf Report and Clients Versions have only the date button and the time zone badge.
The pages do not refresh by themselves. To see new data, press F5 or change the date or time range.
3. Servers page
The Servers page (/servers) is the start page. It lists every server that you
may see. In multiple user mode, an account sees only the servers that its
administrator gave it.
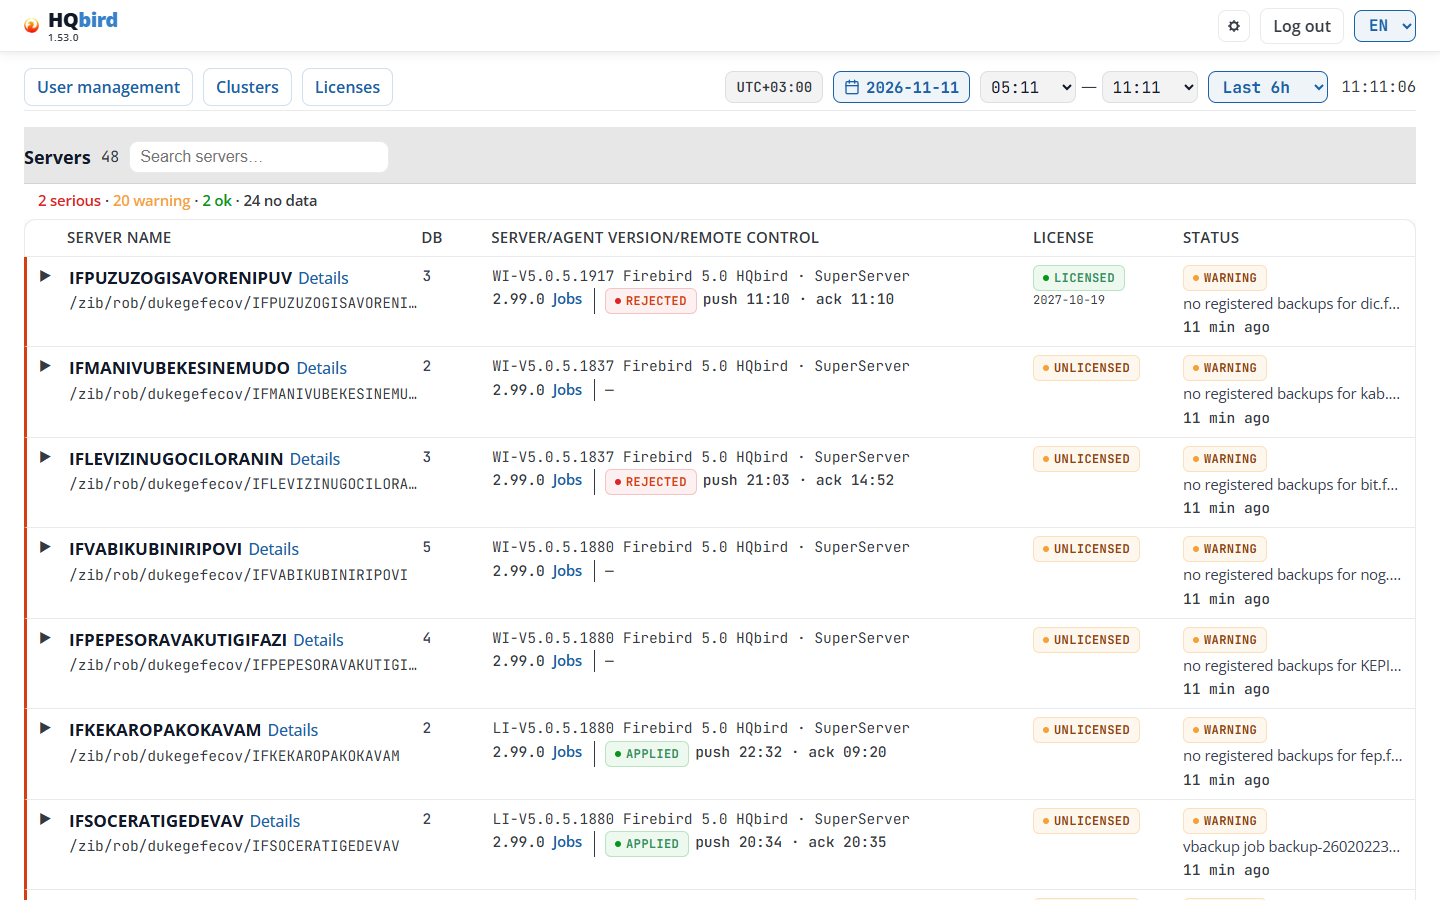
What you see
- The header: the logo with the version, the gear icon, Log out and the language list. This page has no ← Servers and no breadcrumb line.
- The license line, only when an agent stopped license jobs or a trial ends soon (see Header and breadcrumb line).
- The top row:
- User management (administrators in multiple user mode, see Users), Clusters (administrators, see Clusters) and Licenses (everyone, see Licenses);
- the time controls: the time zone badge, the date, From — To, the preset list and the clock (see Date and time range).
- The section line: Servers with the number of servers (here 48),
the search box Search servers… and Collapse all.
- The search finds text in the server name or in the folder path. Upper and lower case do not matter. While you search, the number shows the servers found and all servers, for example 1 / 48.
- Collapse all closes all open rows. It shows only while a row is open.
- The summary line: how many servers have each level, and how many send no data, for example 2 serious · 20 warning · 2 ok · 24 no data.
- The table of servers, one row per server. A long list scrolls inside the table. The servers that send no data are at the bottom.
Date and time range
- The badge shows the time zone offset of the console machine, for example
UTC+03:00; the zone name is in its hint. The clock at the right shows the current time in that zone and updates every second. - The date opens on the newest day that has data on any server.
- The presets are Last 6h (default), Last 12h and Full day. There is no Last 1h on this page. For today, a preset counts back from the current time; for a past day, from 23:59. The range starts at 00:00 at the earliest. Full day is 00:00 to now (today) or 00:00 to 23:59.
- The date and time range apply to the open rows (the status strip and the charts) and to the day of the report that the status badge opens.
- The Status column always shows the agent’s latest status, on any date.
The table
| Column | What it shows |
|---|---|
| Server name | The agent’s name, the Details link to the dashboard, and the data folder of the server under data_path. A long name or path is shortened in the middle; point at it to see it in full. |
| DB | The number of databases, or “—” when the agent has not reported it. |
| Server/Agent version/Remote control | First line: the Firebird version, for example WI-V5.0.5.1880 Firebird 5.0 HQbird, and the mode Firebird runs in: SuperServer, SuperClassic or Classic. Second line: the agent version, the Jobs link, and the delivery status of the last configuration change. |
| License | The license state that the agent reports, and the date that matters under it. Click it to open the License page of the server. |
| Status | The server level badge (a link to the report), the headline of the agent’s verdict and the age of the last status. |
Server/Agent version/Remote control. Point at the cell to see both versions in full.
-
The mode comes from the agent, fbagent 2.94.0 or newer. With an older agent the line shows only the version.
-
When
firebird.confsets another mode, an arrow shows it, for example SuperServer → Classic. Point at the arrow: “firebird.conf sets Classic: it takes effect after a Firebird restart”. -
Jobs opens the configuration editor. It shows only when the console can open the editor for this server.
-
The delivery badge shows how far the last configuration change got: SENT, TAKEN, APPLIED, RESTART NEEDED, REJECTED, ALREADY SET, SUPERSEDED, UNKNOWN or NOT READ. See Delivery status.
-
After the badge:
push 11:10 · ack 11:10, the time the change was sent and the time the agent confirmed it. These times are in the console’s time zone. DRIFT 15′ means the agent has not answered for 15 minutes. -
Point at the badge to see the agent’s reason and the exact times.
-
“—”: no configuration change was ever sent to this server.
-
HQCenter link is not set: the console cannot show delivery. Point at it to see why.
License. The badge shows the state, for example LICENSED, UNLICENSED or NO DATA.
- Under the badge: the date that matters for the state, for example the
expiry date or the end of the trial. When 60 days or fewer are left, the
days follow, for example
2026-12-01 (26 d). - ⚠ after the badge: the agent’s license report is older than 72 hours.
- Point at the cell to see the reason, the customer, Enforcement is off: nothing is blocked. when that is so, and Jobs that need a license: N.
Status. The level badge (see Status colors), the headline and the age of the status.
- The badge is the level of the server, from the agent’s verdict (fbagent schema 26 or newer). An older agent sends no verdict: then the badge shows its old severity.
- When the level of the agent itself is worse, a second small badge shows it, for example Agent: WARNING. Agent problems (upload queue, sources, self-update) do not change the server level.
- Click the badge to open the server health report of the newest snapshot of the selected day.
- Under the badge: the headline of the verdict, for example “no registered backups for employee.fdb”. Point at it to see the full text.
- The last line is the age of the status, for example 9 min ago. Point at it to see the full time. When the agent’s time zone differs from the console’s, the tooltip also shows the agent’s offset at that time.
- no data since <time>: the newest status is older than 30 minutes (3 agent cycles). The badge is grey and shows the time of the last status, not a level. The row has no headline. Click the badge to open the last day with data.
- A language change redraws the badges and the summary line.
Status colors
The agent calculates the status. The console only shows it.
| Badge | Color | Meaning |
|---|---|---|
| CRITICAL, SERIOUS | Red | A serious problem. Act now. |
| WARNING, MINOR | Orange | Something needs attention. |
| OK | Green | No problems found. |
| INFO, — | Grey | No status, or an informational status. |
| no data since … | Grey | The agent sent no status for more than 30 minutes. |
The status comes from the agent’s latest status file. A grey no data since badge means that the agent stopped sending data.
Open a server row
Click a row (or the triangle at its left) to open it. Click it again to close it. You can open several rows. The links in a row (Details, Jobs, the license badge, the status badge) do not open the row.
An open row shows, for the selected date and time range:
- SERVER STATE BY SERVER_STATUS SNAPSHOTS: the status strip.
- CPU LOAD / LOAD AVERAGE / MEMORY: a chart.
- CONNECTIONS & DATABASES: a chart.
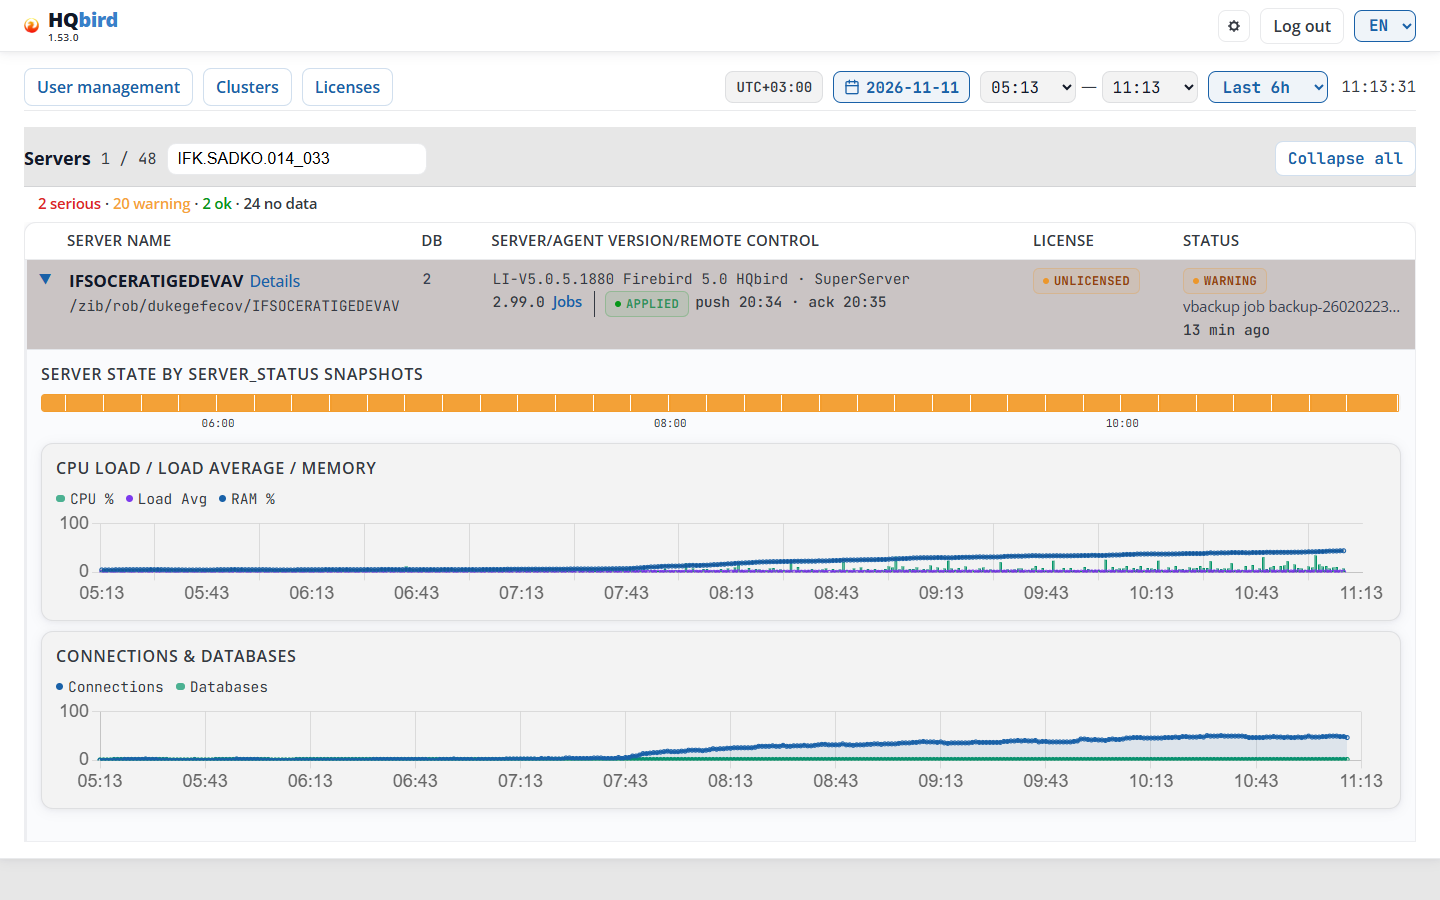
The status strip is a bar of colored cells, one cell for each status snapshot of the agent (or for a group of snapshots when the range is long; a group takes the color of its worst snapshot). The time labels under the bar are in the server’s time zone.
- green, orange, red: the server level of that snapshot (OK, WARNING, SERIOUS). Agent problems (queue, sources, update) do not color the strip.
- hatched: no snapshots in that time (the agent did not send data).
- empty: no data at all (before the oldest snapshot, or in the future).
Point at a cell to see the time, the level, the headline and the problem
areas, for example 10:20–10:30 · SERIOUS · … · Disk speed, Locks. Click a
cell to open the server health report of that
snapshot.
- With the keyboard: Tab to the strip, then the arrow keys, Home and End. Enter opens the report, Escape hides the tip.
- On a touch screen the first tap shows the tip, the second tap opens the report.
Both the status badge and the strip show the server level. The agent level is the small Agent: badge only.
The charts use the server’s time zone too. When the server’s zone differs from the console’s, the times under the strip and the charts differ from the range at the top. In the picture both zones are UTC+03:00, so the range 05:13–11:13 is the same on both clocks.
- CPU Load / Load Average / Memory: legend CPU %, Load Avg,
RAM %. CPU in percent (bars), load average and memory in percent
(lines), on a 0–100 scale. A CPU bar is green up to 70%, orange from
70% to 90%, and red from 90%. A minute without data has no bar. The
memory line’s tip also shows used and total RAM, for example
RAM %: 63 (10.1 GB / 16.0 GB). Windows has no load average: the chart is CPU Load / Memory, without that line. - Connections & Databases: legend Connections and Databases. The number of connections and of active databases.
Point at a chart to see all values of that minute in a box above the chart. When you change the date or the time range, all open rows load again.
Messages on the Servers page
| Message | What it means |
|---|---|
| No server_status snapshots for this interval | The strip has no status snapshots in the range, or they cannot be loaded. Choose a longer range or another date. |
| Loading… | The chart is loading. |
| No data | The chart has no data in the range. |
| Error | The chart data cannot be loaded. Press F5. |
| No data / cannot load servers | The server list cannot be loaded. The error text follows. Press F5; if it stays, ask the administrator. |
| Waiting for the first data from the agent | No server has sent data to this console yet, for example right after a new install. This takes 1-2 minutes. The page checks again every 10 seconds and opens the table by itself when a server appears. |
| Still no data after 5 minutes. Check that the HQbird agent service is running and that it sends data to this console. | Shows under the message above after 5 minutes. Check the agent service and its console address. |
| “—” in Status | The console cannot read a status file of this server (none yet, or it is damaged). |
| no data since <time> (Status) | The newest status of this server is older than 30 minutes. Check that the agent service runs and sends data. |
| NO DATA (License) | The agent has not reported a license state. |
| HQCenter link is not set (Remote control) | The console cannot show configuration delivery. Point at it to see why. |
Tips
- Type part of a name in Search servers… to find a server in a long list.
- A grey no data since badge means the agent stopped sending data. Open the row: hatched cells in the strip show when it stopped.
- The summary line counts the servers by level. The servers with no data are at the bottom of the table.
- To compare the load of several servers, open their rows one under the other.
4. Server dashboard
The dashboard (/dashboard?server=<name>) shows one server. Open it with the
Details link on the Servers page. The page opens with today and the time
range Last 1h.
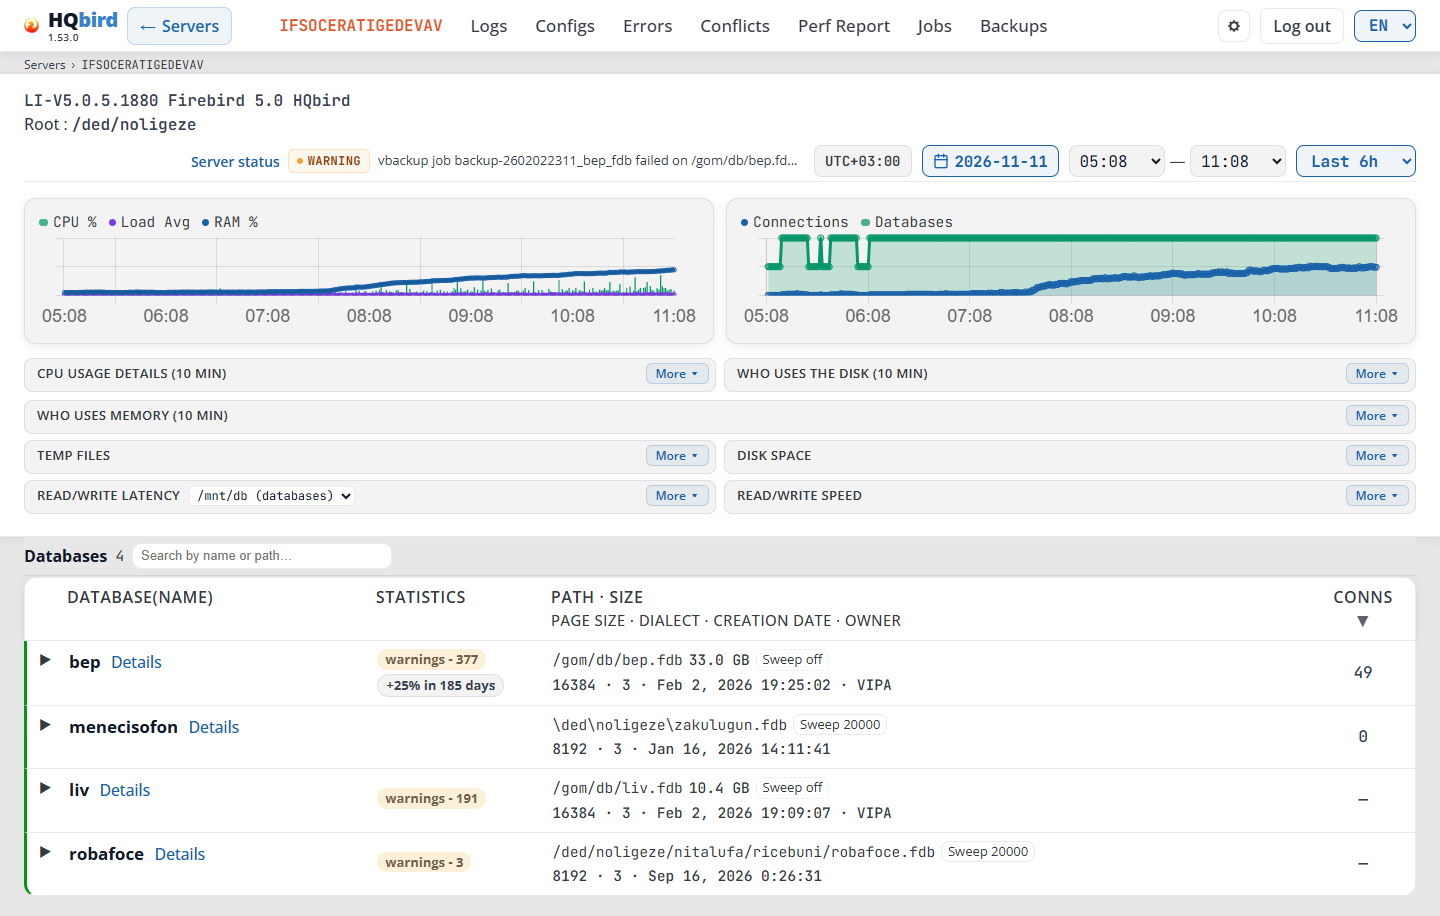
What you see (the picture shows the range Last 6h):
- The header: ← Servers, the server name and the menu of server tools (see Header).
- The breadcrumb line: Servers › SRV.
- The time bar. At the left: the Firebird version and Root. At the right: Server status with its badge and headline, the time zone, the date, the start and end time, and the time preset.
- Two charts that are always open: CPU % / Load Avg / RAM % and Connections / Databases.
- The cards you can open and close: CPU usage details (10 min), Who uses the disk (10 min), Who uses memory (10 min), Temp files, Disk space, Read/write latency with the disk list, and Read/write speed.
- The databases table: Databases with their count, the search box, and one row per database.
The time bar:
- The Firebird version, for example
LI-V4.0.5 Firebird 4.0. It shows — when the version is not known. - Root: the Firebird folder on the server, for example
/opt/firebird. It is hidden when the agent did not send it. - Server status: see Server status.
- The time zone of the server times on the page. See Time and time zone.
- The date button: choose another day in the calendar.
- The start and end time: set the range by hand.
- The time preset: Last 1h (the default), Last 6h, Last 12h, Full day and Selected. Selected is active only after you set the start or end time by hand.
Cards closed and open
Seven cards can be closed: CPU usage details, Who uses the disk, Who uses memory, Temp files, Disk space, Read/write latency and Read/write speed. All of them start closed: one thin line with the title and More. The picture above shows this default view. The picture below shows the same page with all cards open.
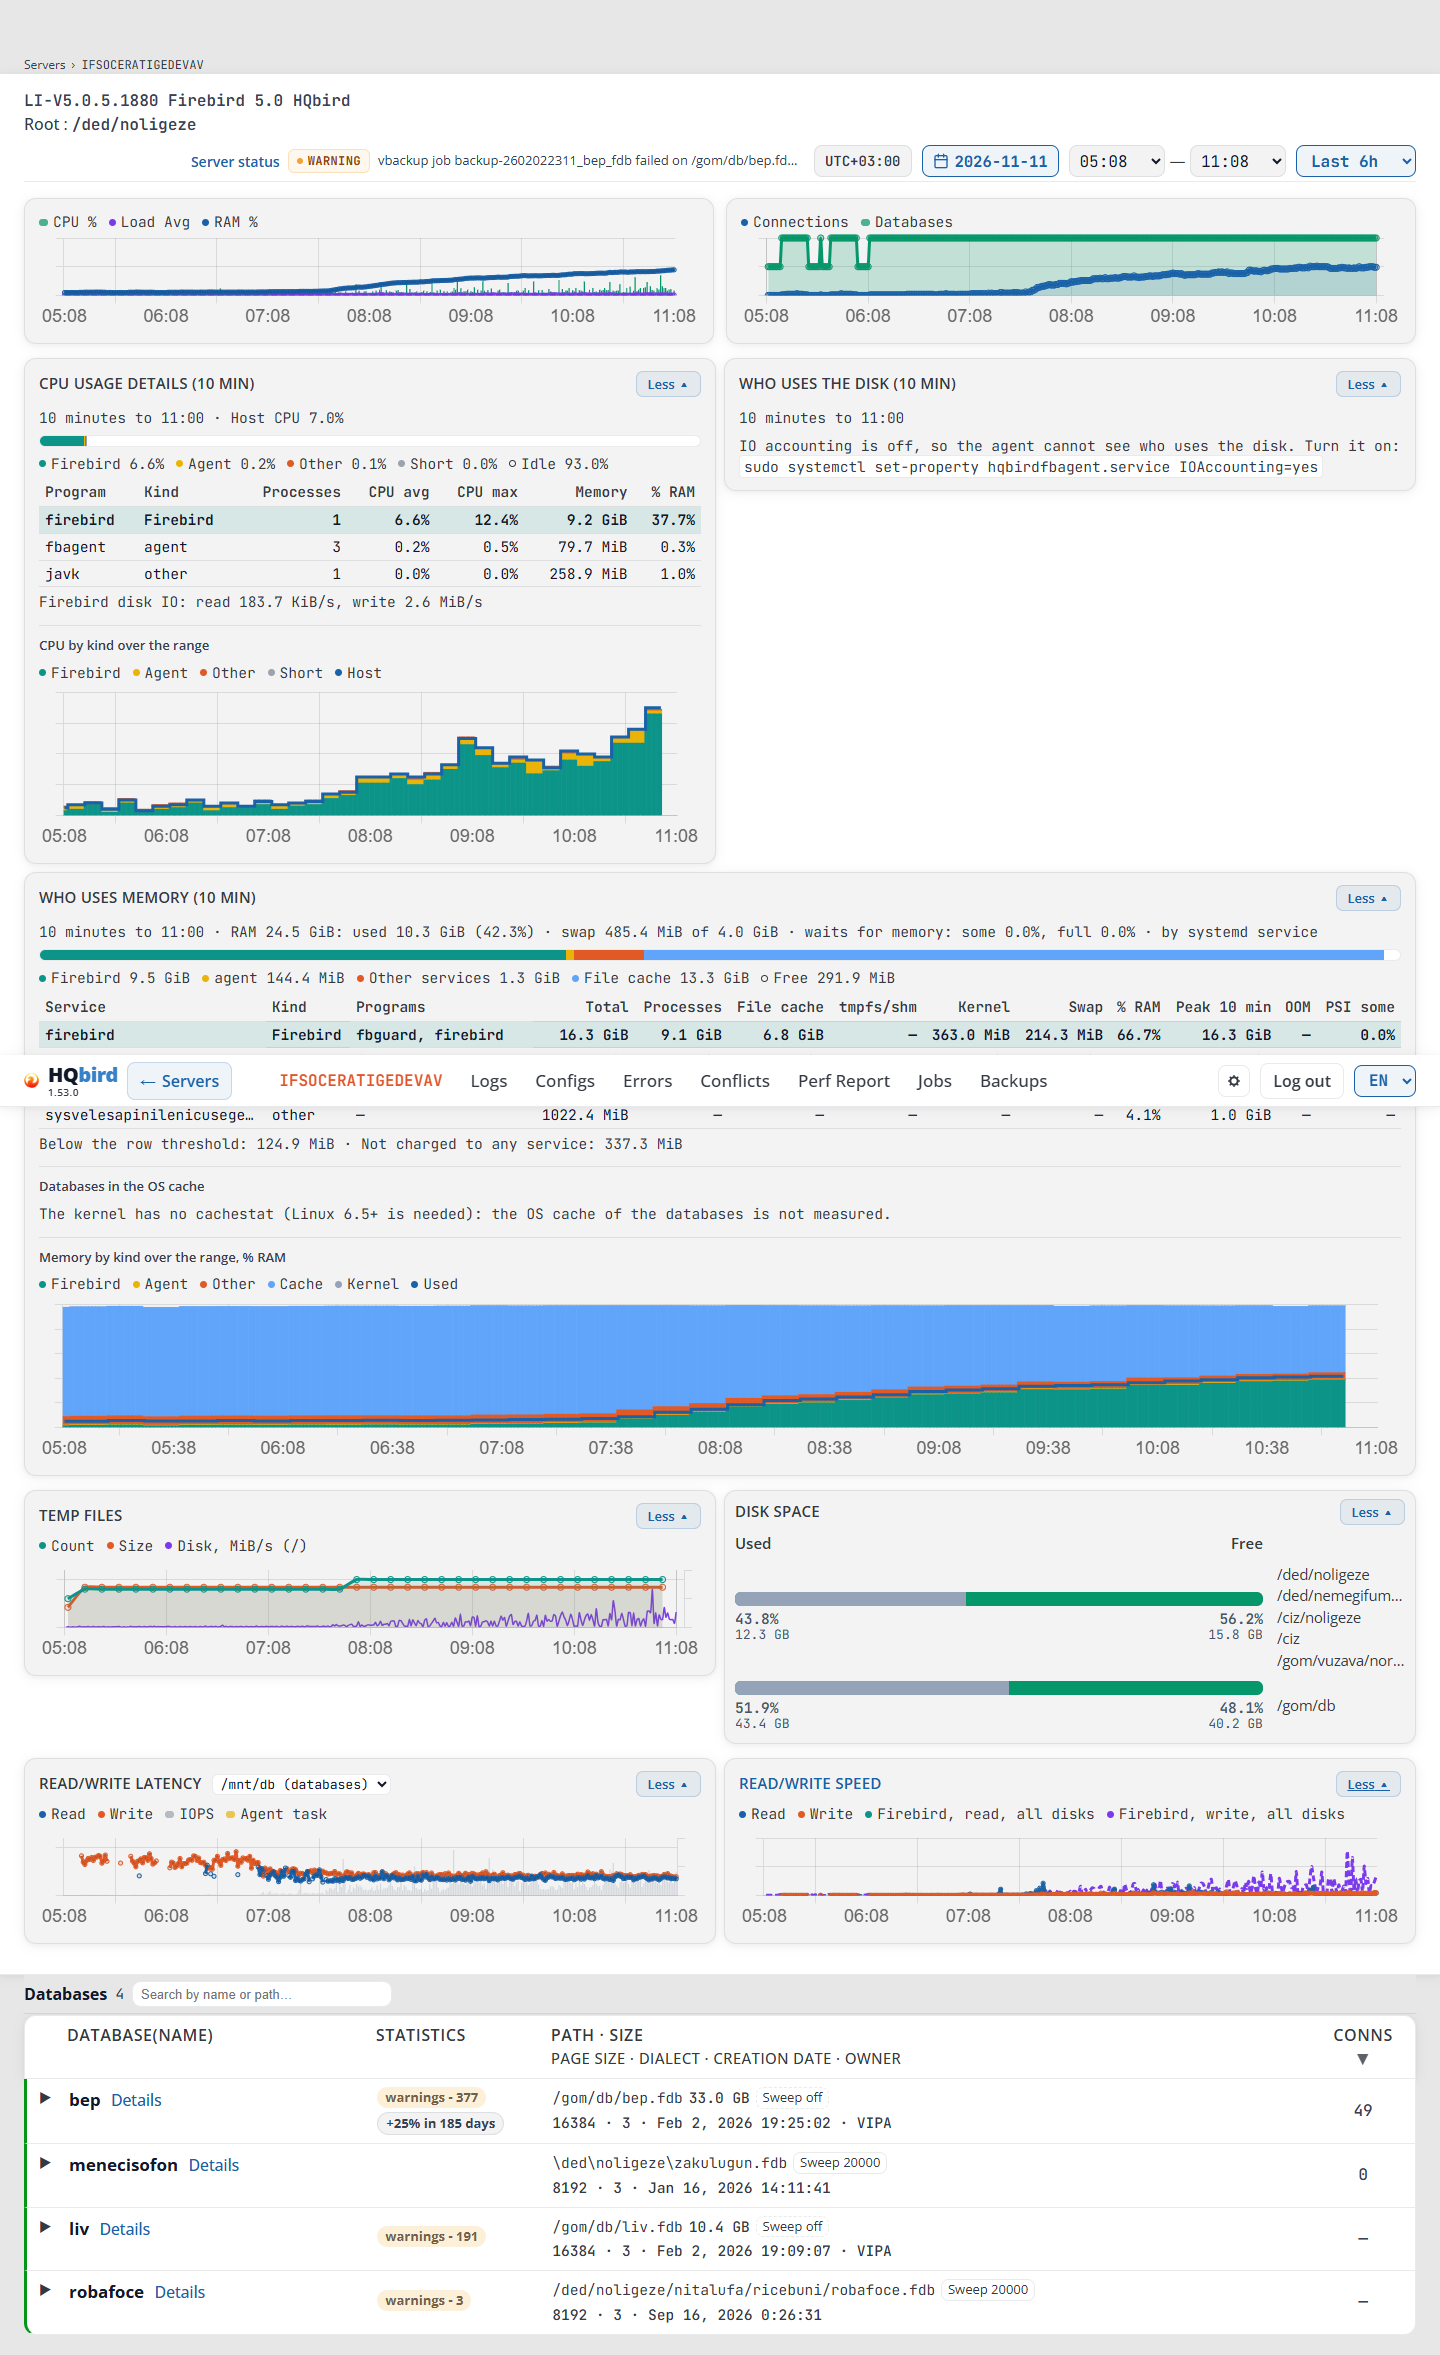
- To open a card, click its title line or More.
- To close it, click Less or the title line again.
- The browser keeps the list of open cards in the cookie
fbmonitor.dashboard.openfor 365 days. The list is the same for every server: a card you open on one server is open on the other servers too. - The line under the title (the snapshot time, the host CPU, the RAM and so on) shows only when the card is open.
- The disk list of Read/write latency stays in the title line when the card is closed. You can choose a disk without opening the card. A click on the list does not open or close the card.
- A card shows only when it has data. For example, an agent that does not send the list of programs shows no CPU usage details card.
Layout. From a width of 769 px the cards stand in two equal columns. Who uses the disk stays in the right column, also when CPU usage details is not shown. Who uses memory takes the full width. On a phone there is one card in a row.
Header
- ← Servers at the left returns to the server list. All other server pages have this button too.
- The server name.
- The menu of server tools: Logs, Configs, Errors, Conflicts, Perf Report, Jobs and Backups. Jobs and Backups show only when the agent configuration of this server is available. On the other server pages the menu marks the page you are on.
- At the right: the gear icon (see Settings (gear icon)), Log out and the language list.
- The breadcrumb line under the header: Servers › SRV on the dashboard, Servers › SRV › Logs on a tool page. Every step but the last is a link; Servers returns to the server list.
- A red or yellow license banner can show under the breadcrumb line when a server has no license or its trial ends soon.
Server status
Server status in the time bar opens the server health report of the newest status snapshot in the selected range.
- The badge next to it is the level of that snapshot, for example WARNING. Point at it to see Last snapshot: HH:MM.
- After the badge, one line shows the headline of that snapshot and the systems with findings, for example “vbackup job … failed on …”. Point at it to see the full text. Click it to open the report of that snapshot. In demo mode the names in it are masked.
- When the range has no snapshot, there is no badge and no headline. The link then opens the report of the selected date.
- The strip of snapshots per minute is on the Servers page and in the report itself.
Server charts
The charts have no numbers on the value axis, only the times under it: point at a chart to see the values with their units. The legends are short, because the card title already says what the chart is. Point at a legend item to see its full name.
Point at a chart to see all values of that minute. The box shows above the chart, so it does not cover the lines (below it when the window has no room above).
Messages you may see:
| Message | What it means |
|---|---|
| No data / cannot load dashboard | The console could not load the data of this server. The box lists the Requests and the Diagnostics: one line per data source with OK or MISSING. Check that the agent sends data. |
CPU % / Load Avg / RAM %
Always open. One point a minute.
| Line | What it shows |
|---|---|
| CPU % | The processor load of the host, as bars. A bar is green up to 70%, orange from 70% to 90%, and red from 90%. Grey means no data. |
| Load Avg | The load average of the host. Windows has no load average: no line and no legend item. |
| RAM % | The memory use. The tip adds used and total memory, for example RAM %: 63 (10.1 GB / 16.0 GB). |
| New RAM % basis | A dashed amber line at the minute when the agent changed how it counts RAM %. The legend item shows only when the range has such a minute. |
- On Linux the agent counts used memory as total − available, so tmpfs and shared memory are in it (fbagent 2.93.0 and newer).
- An agent that counted it the old way moves to the new basis when it updates. The tip at that minute says: The agent changed how RAM % is counted (now: total − available). The step here is not a change of memory use. The same mark is on the Memory by kind chart of Who uses memory.
Connections / Databases
Always open. One point a minute.
| Line | What it shows |
|---|---|
| Connections | The number of connections to all databases of the server. |
| Databases | The number of active databases. |
CPU usage details
The card CPU usage details (10 min) shows how the host used its CPU in the 10 minutes before one server status snapshot:
- with no selected minute: the newest snapshot of the range;
- with a selected minute: the snapshot whose 10 minutes hold that minute.
The cards Who uses the disk and Who uses memory use the same snapshot.
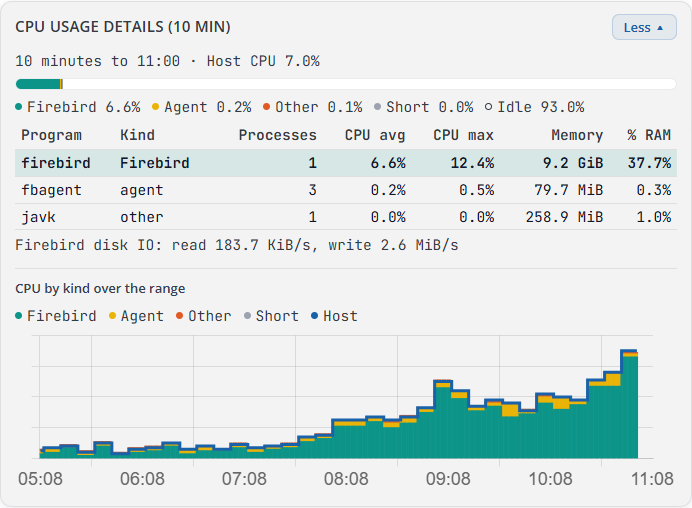
What you see:
- The line
10 minutes to 19:50 · Host CPU 6.0%: the end of the 10 minutes and the average CPU of the whole host. Host CPU unknown when the agent could not read it. - A bar of the host CPU with its legend: Firebird, Agent, Other, Short and Idle, each with its percent. Short is processes that started and ended between two passes of the agent: too short to name. Idle shows only when the host CPU is known.
- The table of programs (see the columns below).
- On Linux: Firebird disk IO: read 24.7 KiB/s, write 10.1 MiB/s, the disk read and write of the Firebird processes. The write is — when the agent did not send it (an agent before 2.89.0, or the first minutes after an update).
- CPU by kind over the range: the same CPU split for every snapshot of the range, as stacked areas Firebird, Agent, Other and Short, with the Host line (host CPU).
| Column | What it shows |
|---|---|
| Program | The program name. The Firebird row is highlighted. |
| Kind | Firebird, agent, kernel or other. |
| Processes | How many processes of this program ran. |
| CPU avg | The average CPU of the program in the 10 minutes, in % of the whole host. |
| CPU max | The highest CPU of the program in the 10 minutes, in % of the whole host. |
| Memory | The memory the processes of the program hold (RSS). |
| % RAM | That memory in % of the host RAM. |
Messages you may see:
| Message | What it means |
|---|---|
| This snapshot has no list of programs (an older agent, or system_metrics.programs is off). | Other snapshots of the range have the list, this one does not. Select another minute, update the agent, or turn the switch on. |
- The card needs fbagent 2.89.0 or newer and the switch CPU and memory by
program (
system_metrics.programs) in the Settings tab of the agent configuration. - When no snapshot of the range has the list, there is no card.
Who uses the disk
The card Who uses the disk (10 min) shows who moved the bytes of one disk in the 10 minutes of the CPU usage details snapshot. The disk is the one you choose in the list of Read/write latency.

The picture shows the card on a Linux server where IO accounting is off: the card says so and gives the command that turns it on (see the messages below).
What you see when the agent has data:
- The line
10 minutes to 19:50 · disk sda: read 38.5 KiB/s, write 15.7 MiB/s · by systemd service: the end of the 10 minutes, the read and write of the whole disk, and the source of the rows. by systemd service on Linux (a row is a systemd service), by process (ETW) on Windows (a row is a process). - The table (see the columns below).
- The line Not in the rows: 2.1 MiB/s (other services, the kernel): the bytes of the disk that no row explains.
| Column | What it shows |
|---|---|
| Service | The service or process. The Firebird row is highlighted. |
| Kind | Firebird, agent, other or user session. · shared means other programs run in the same group, so these bytes are not only from this service. |
| Programs | The programs of the row. Point at the cell to see the full list. |
| Read/s | Bytes read per second. |
| Write/s | Bytes written per second. |
| % of disk | The share of the row in all bytes of the disk. |
Messages you may see:
| Message | What it means |
|---|---|
IO accounting is off, so the agent cannot see who uses the disk. Turn it on: sudo systemctl set-property <unit> IOAccounting=yes |
Linux does not count IO per service. Run the command once on the server. The unit is the service of the agent; <agent unit> when the console does not know it. |
| Needs cgroup v2: this host runs cgroup v1. | The host uses the old cgroup system. The card cannot work there. |
| No cgroup v2 file system is mounted: the agent cannot see who uses the disk. | Mount the cgroup v2 file system, or use a host that has it. |
| The agent could not start its ETW session (it needs administrator rights). | Windows: run the agent service with administrator rights. |
| The ETW session lost events: no table for these 10 minutes. | Windows: the counts are not complete, so the card shows no table. Select another minute. |
| Not measured: {reason} | The agent could not measure this disk. The reason follows. |
| No data for this disk in these 10 minutes. | The snapshot has rows for other disks, not for the chosen one. |
- The card needs fbagent 2.90.0 or newer and the switch Disk IO by
service (
disk_io.by_service) in the Settings tab. - There is no card when the Read/write latency row is hidden, or when the snapshot has neither rows nor a reason.
Who uses memory
The card Who uses memory (10 min) shows who holds the RAM, from the CPU usage details snapshot. It takes the full width under the CPU and disk cards.
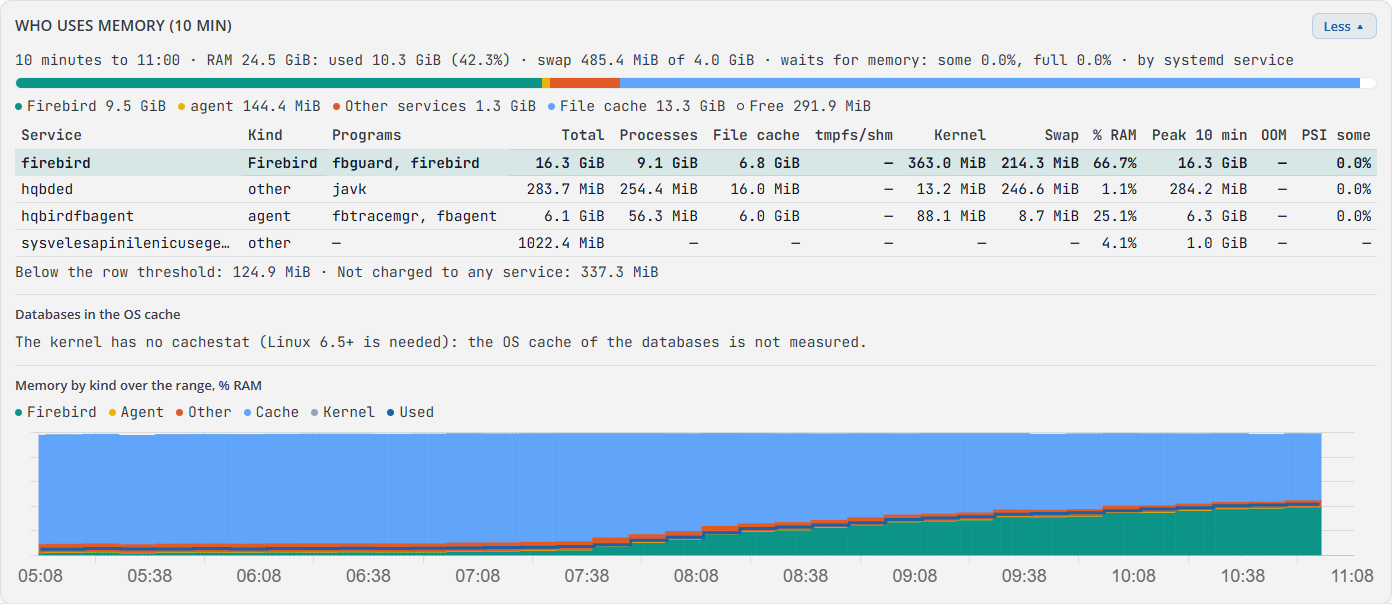
What you see:
- The line under the title.
- Linux:
10 minutes to 19:50 · RAM 64.0 GiB: used 27.8 GiB (43.4%) · swap 3.9 GiB of 8.0 GiB · waits for memory: some 0.0%, full 0.0% · by systemd service. waits for memory is the share of time when some or all processes waited for memory (PSI). - Windows:
10 minutes to 19:50 · RAM 16.0 GiB: available 6.1 GiB, used 62.0% · commit 11.2 GiB of 20.0 GiB · by program.
- Linux:
- A bar of the whole RAM with its legend.
- Linux: Firebird, agent, Other services, File cache, Kernel and the rest and Free. The service parts do not include their file cache. Kernel and the rest is the kernel, the memory no service is charged with, and the services below the row threshold.
- Windows: Firebird, agent, Other programs, System file cache, System and shared pages and Available. The program parts are their private working sets.
- The table of services (Linux) or programs (Windows). See the columns below.
- The line under the table:
- Below the row threshold: {bytes}: the services that are too small for a row. A row of another service needs 64 MiB, or 1% of the RAM when that is less. The table has 8 rows at most.
- Other services: {bytes} (the names are off: system_metrics.programs): the switch CPU and memory by program is off, so only Firebird and the agent have rows.
- Not charged to any service: {bytes} (Linux): memory that belongs to no service.
- Databases in the OS cache (Linux): see below.
- Memory by kind over the range, % RAM: see below.
Linux columns (a row is a systemd service):
| Column | What it shows |
|---|---|
| Service | The systemd service. The Firebird row is highlighted. · gone means the service is not in the newest minute: the numbers are from the last minute that listed it. |
| Kind | Firebird, agent, other or user session. · shared: other programs run in the same group. · limit X: the hard memory limit of the service. · high X: its soft limit (the kernel slows the service down above it). |
| Programs | The programs of the service. |
| Total | All memory charged to the service. |
| Processes | The memory of its processes. |
| File cache | The file cache charged to the service. |
| tmpfs/shm | Files in memory and shared memory. |
| Kernel | Kernel memory charged to the service. |
| Swap | The part of its memory in swap. |
| % RAM | The memory in % of the host RAM. |
| Peak 10 min | The highest memory of the service in the 10 minutes. |
| OOM | How many processes the out-of-memory killer stopped. Point at it to see the programs that were likely killed. |
| PSI some | The share of time when some processes of the service waited for memory. Point at it to see the share when all of them waited. |
Windows columns (a row is a program):
| Column | What it shows |
|---|---|
| Program | The program. The Firebird row is highlighted. |
| Kind | Firebird, agent or other, with the same marks as on Linux. |
| Services | Up to 3 Windows services of the program. |
| Processes | How many processes of the program ran. |
| Committed | The private memory the program committed. |
| Private WS | The private part of its working set. |
| Working set | Its whole working set, with shared pages. |
| Kernel pools | Kernel pool memory of the program. |
| % RAM | The memory in % of the host RAM. |
| Peak 10 min | The highest memory of the program in the 10 minutes. |
Compare with MON$. Firebird itself reports the memory it allocated
(MON$MEMORY_USAGE). Point at the Processes cell (Linux) or the
Committed cell (Windows) of the Firebird row. The tip compares the two
numbers. It shows only when there is exactly one Firebird row and the agent
read MON$ in the 10 minutes of the snapshot.
Who holds the file cache. Linux charges a file cache page to the service that read it first. So a backup can hold a large part of a database’s cache.
Databases in the OS cache (Linux 6.5 and newer): how much of each database file the OS cache holds. The table has 8 rows at most, the largest cache first.
| Column | What it shows |
|---|---|
| Database | The database name. Point at it to see the path. · O_DIRECT means Firebird opens this file with O_DIRECT: its pages are not in the OS cache. |
| File | The size of the file. |
| In the OS cache | How much of the file the cache holds. |
| % of file | The same in % of the file. |
| Dirty | Changed pages that are not on the disk yet. |
| Recently evicted | How much the cache dropped recently. |
Under the table: Other database files: {files}, {bytes} in the cache. and The OS cache is shared: the kernel gives it back when programs need memory.
Memory by kind over the range, % RAM: the RAM split for every snapshot of the range, as stacked areas Firebird, Agent, Other (other services), Cache (file cache) and Kernel (kernel and the rest), from 0 to 100%. The Used line is RAM %. New RAM % basis marks the minute when the agent changed how it counts RAM %. Only snapshots of fbagent 2.93.0 and newer have this split, so older minutes are empty.
Messages you may see:
| Message | What it means |
|---|---|
Memory accounting is off, so the agent cannot see which service holds the memory. Turn it on: sudo systemctl set-property <unit> MemoryAccounting=yes |
Linux does not count memory per service. Run the command once on the server. |
| Needs cgroup v2: this host runs cgroup v1. | The host uses the old cgroup system. The table cannot work there. |
| No cgroup v2 file system is mounted: the agent cannot see which service holds the memory. | Mount the cgroup v2 file system. |
| The agent could not read the process list in these 10 minutes. | The agent could not list the processes. Select another minute. |
| This snapshot has no memory by service (an older agent, or system_metrics.memory_by_service is off). | Update the agent or turn the switch on. |
| The kernel has no cachestat (Linux 6.5+ is needed): the OS cache of the databases is not measured. | The kernel is older than 6.5. Databases in the OS cache stays empty. |
| no access to the file (in a row) | The agent cannot open this database file. |
| the file is gone (in a row) | The database file no longer exists. |
- The card needs fbagent 2.93.0 or newer and the switch Memory by
service (
system_metrics.memory_by_service) in the Settings tab. - There is no card when the snapshot has no memory data and no reason, and the range has no memory split to draw.
Temp files
Firebird temporary files: how many and how big, one point a minute.
| Legend item | What it shows |
|---|---|
| Count | The number of temp files. The tip lists the kinds of files, most files first: temp files by name prefix (fb_sort, fb_blob, fb_undo, …) and the files of Firebird’s own lock folder (fb_lock, fb_monitor, fb_trace, …). The count includes both. |
| Size | The size of the temp files. |
| Disk, MiB/s (sda, with DB) | The speed of the disk with the temp folder: read + write, MiB per second (the sum when temp is on several disks). with DB means the databases are on the same disk. |
- Temp files in memory: no disk line: the temp folder is in memory, so there is no disk line.
- Temp disk not measured: {disk} network disk (or no counters): the agent has no disk counters for the temp folder.
- Agents without the disk IO task show no disk line and no legend item.
Disk space
One bar per disk: used and free space in percent, with the sizes under the percents. The data is from the last disk snapshot of the chosen day.
- Point at a bar to see the mount, Disk space used, Disk space free and Disk size.
- The paths at the right are the folders on that disk that the agent watches. Up to 5 show; More shows all of them, Less hides them.
- An agent older than the size fields shows only percents.
| Message | What it means |
|---|---|
| No disk usage data for the selected day. | The agent sent no disk snapshot for the chosen day. |
Read/write latency
For one disk with databases or Firebird temp files: the average time of a read and of a write in the minute, and the operations per second.
The disk list is in the title line. Each item is a disk with its role,
for example sda (databases, temp). Disks with databases come first. The
list is disabled when the server has one disk. Your choice also changes
Read/write speed and Who uses the disk.
| Legend item | What it shows |
|---|---|
| Read | The read latency, in ms. |
| Write | The write latency, in ms. |
| IOPS | Operations per second. The tip adds how busy the disk was, for example IOPS: 120 (busy 35%). |
| Agent task | A yellow band at the minutes when one of the agent’s own heavy tasks ran for 5 seconds or more: disk speed test, backup, restore, sweep, validation, full statistics or index recalculation. The tip names the task. Slow minutes inside the band come from the agent, not from the users. |
- There is no row with Read/write latency and Read/write speed for agents without the disk IO task, or when no disk was measured.
Read/write speed
The same disk: bytes read and written per second.
| Legend item | What it shows |
|---|---|
| Read | Bytes read per second on the disk. |
| Write | Bytes written per second on the disk. |
| Firebird, read, all disks | Dashed line: what the Firebird processes read on the whole server, not on this disk only (Linux). |
| Firebird, write, all disks | Dashed line: what the Firebird processes wrote on the whole server (Linux). |
- When the agent sees the services of the disk (Who uses the disk) for every minute of the chart, the dashed lines are Firebird’s IO on this disk only. The legend then says Firebird, read and Firebird, write; point at a legend item to see Firebird reads per second, this disk. The tip names the source of each minute.
- When the Firebird lines are much lower than the disk’s reads or writes, another program loads the disk.
- Firebird’s writes do not count the data of temporary files deleted before it reached the disk (sort files, shared memory). The tip shows it as Firebird, dropped before the disk. Agents before 2.89.0 counted it, so for them the write line is not drawn.
- Under the chart: Not measured: with the temp or database folders that have no disk counters (in memory, network disk, no counters).
- On Windows only the read line, for this disk: writes through the cache belong to the system.
Select a minute
Click any point on any chart, also on the charts of an open database row. The console:
- draws a blue line at that minute on all charts;
- shows Selected minute: HH:MM next to the search box, with the Report for this minute link when a status snapshot covers that minute: the health report of that snapshot;
- switches CPU usage details, Who uses the disk and Who uses memory to the snapshot whose 10 minutes hold that minute;
- loads trace data and connections for that minute in every open database row.
Changing the date, the time preset or the start or end time clears the selected minute.
Databases table
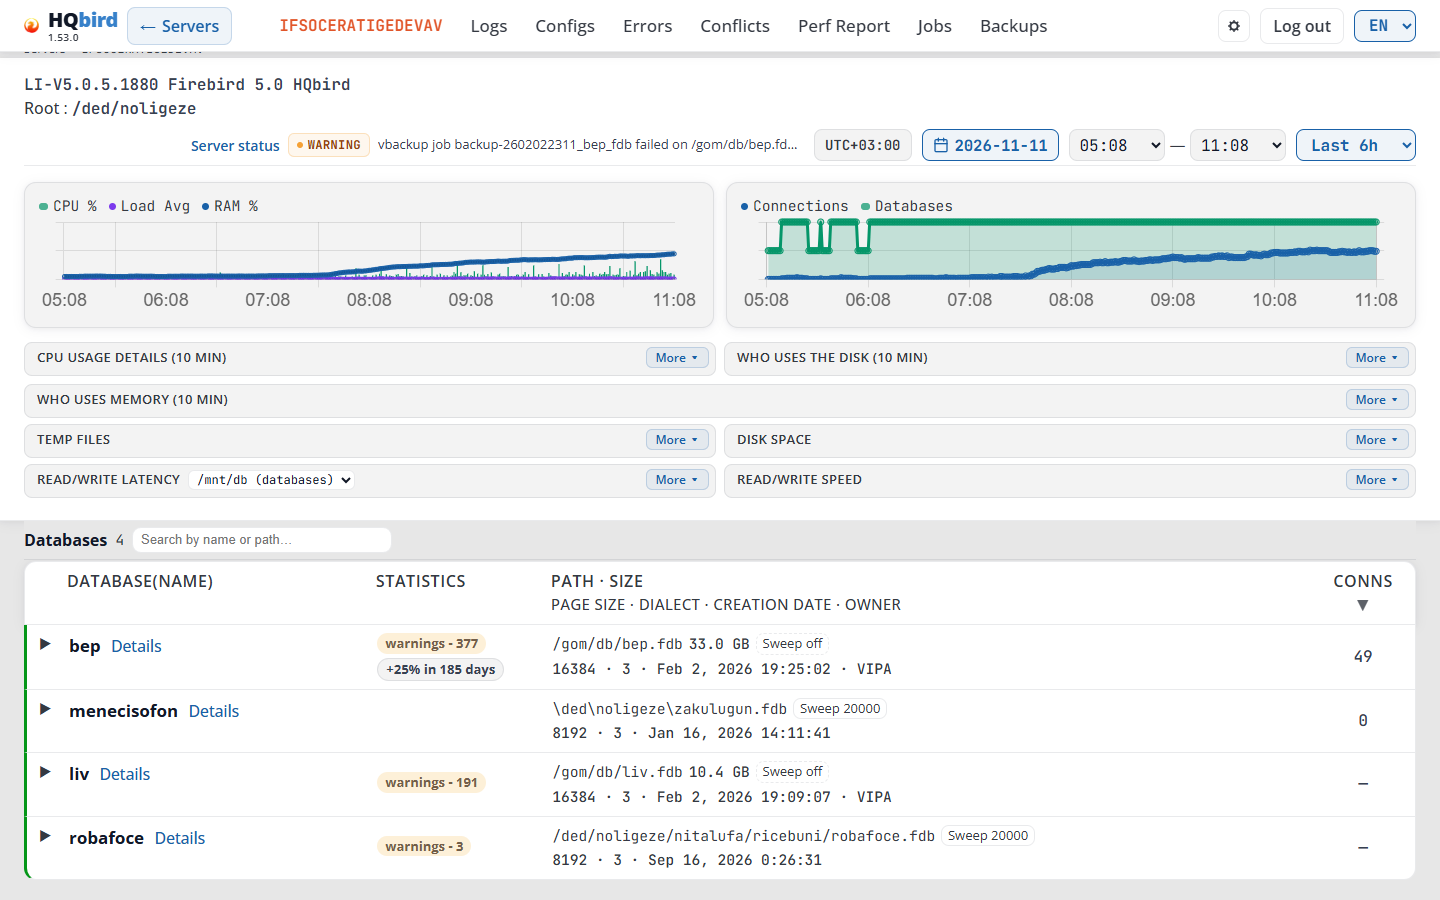
What you see:
- Databases and their count.
- Search by name or path…: type to filter the list.
- Selected minute: HH:MM and Report for this minute, when a minute is selected.
- Collapse all: closes all open rows. It shows only while a row is open.
- One row per database. Click a row to open it (see Open a database row).
| Column | What it shows |
|---|---|
| Database(Name) | The database name, shortened in the middle when it is long (point at it to see the full name). Under it: the state badges. Details opens the database pages with the same date and time range. |
| Statistics | Badges from the newest gstat snapshot (see below). |
| Path · Size / Page size · Dialect · Creation date · Owner | First line: the database file path, the copy button, the size, the Sweep chip and the security chip. Second line: page size, SQL dialect, creation date and owner. |
| Conns | Connections in the last snapshot of the range. Point at it to see As of HH:MM:SS. — means no data for this database in the range. Click the header to sort. |
- Path: a long path is shortened in the middle. The copy button (Copy path) copies it; it is hidden in demo mode.
- Size is the size of all database files on disk, from the newest measurement in the selected range. It is in MB below 1024 MB and in GB above. Point at it to see the exact number of bytes. A database without this measurement shows no size.
- Owner is the database owner (
MON$OWNER). — marks an empty field on the second line. - The security chip shows where logins to the database are checked when this is not the server’s own security database: sec: <file> for a private security database, self when the database checks its own logins.
- Owner and security chip need fbagent 2.78.0 or newer.
State badges and the Sweep chip
A state badge under the name shows when the database is not in normal state:
| Badge | Colour |
|---|---|
| Full shutdown | red |
| Single-user shutdown, Multi-user shutdown, Shutdown (maintenance), nbackup lock | amber |
| nbackup merge, Replica (read-only), Replica (read-write), Replica, Read only | blue |
- Point at a badge to see its source: From the database header, HH:MM or From MON$DATABASE, HH:MM. The newer of the two wins.
- stale is added, and the badge is faded, when the sample is more than 15 minutes older than the end of the range.
- A database in full shutdown has no connections, so the agent lists it from its header.
The Sweep chip after the size shows the automatic sweep interval from the database header: Sweep 20000, or Sweep off (dashed border) when the interval is 0. Point at it to see the full text.
State badges from the header and the Sweep chip need fbagent 2.91.0 or newer.
Statistics badges
- critical - {n} (red) and warnings - {n} (amber): problems that the
statistics analyzer found in the newest
gstatsnapshot. Point at a badge to see the snapshot time and file. Click it to open the Statistics page on the Analysis and Recommendations tab. - +25% in {n} days: the fastest-growing table or index will grow by 25% in that many days. Point at it to see the object, the date and the growth per day. The badge is grey, and red when this is 30 days or less. Click it to open Trends › Forecasts with the finest sensitivity.
Messages you may see:
| Message | What it means |
|---|---|
| No data / cannot load databases | The database list did not load. The error text follows. |
| — in Conns | No connection data for this database in the range. |
Open a database row
Click a database row. It shows two charts:
- Transactions: Next-Oat, OST − OIT and Active Δ (see Transaction counters).
- LWM: active attachments (activeAtt), active requests (activeReq), execution time (execTime Δ), fetches and errors, per minute.
Click a legend item to hide or show its line.
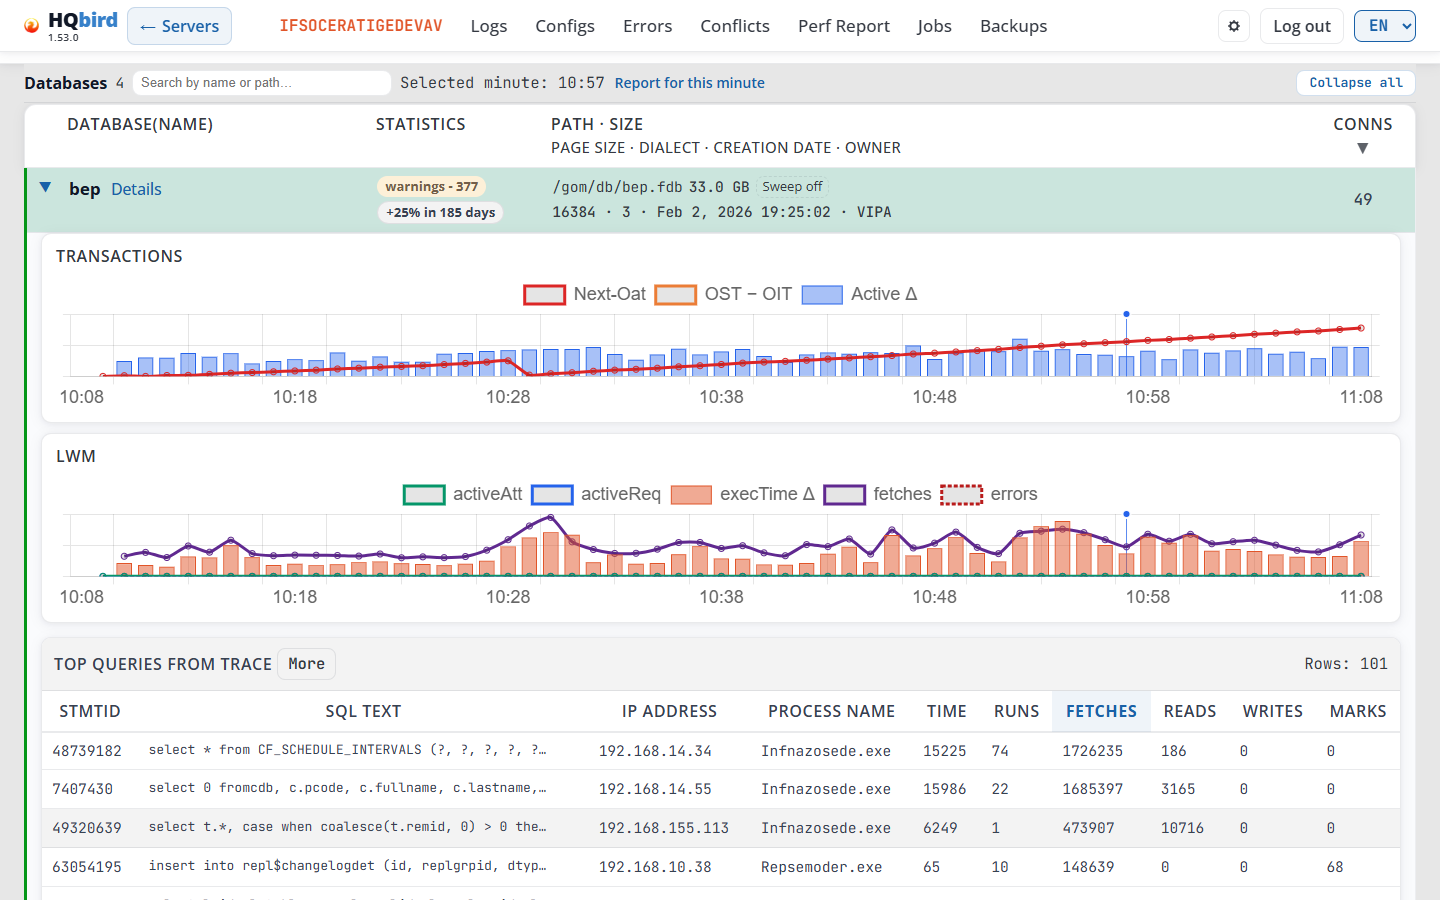
Up to 3 database rows can be open. Opening a 4th one closes the oldest.
When a minute is selected, the open row also shows two tables. Each table shows 5 rows. Rows: n shows how many there are. Click More to see all rows, Less to see 5 again. Click a header to sort.
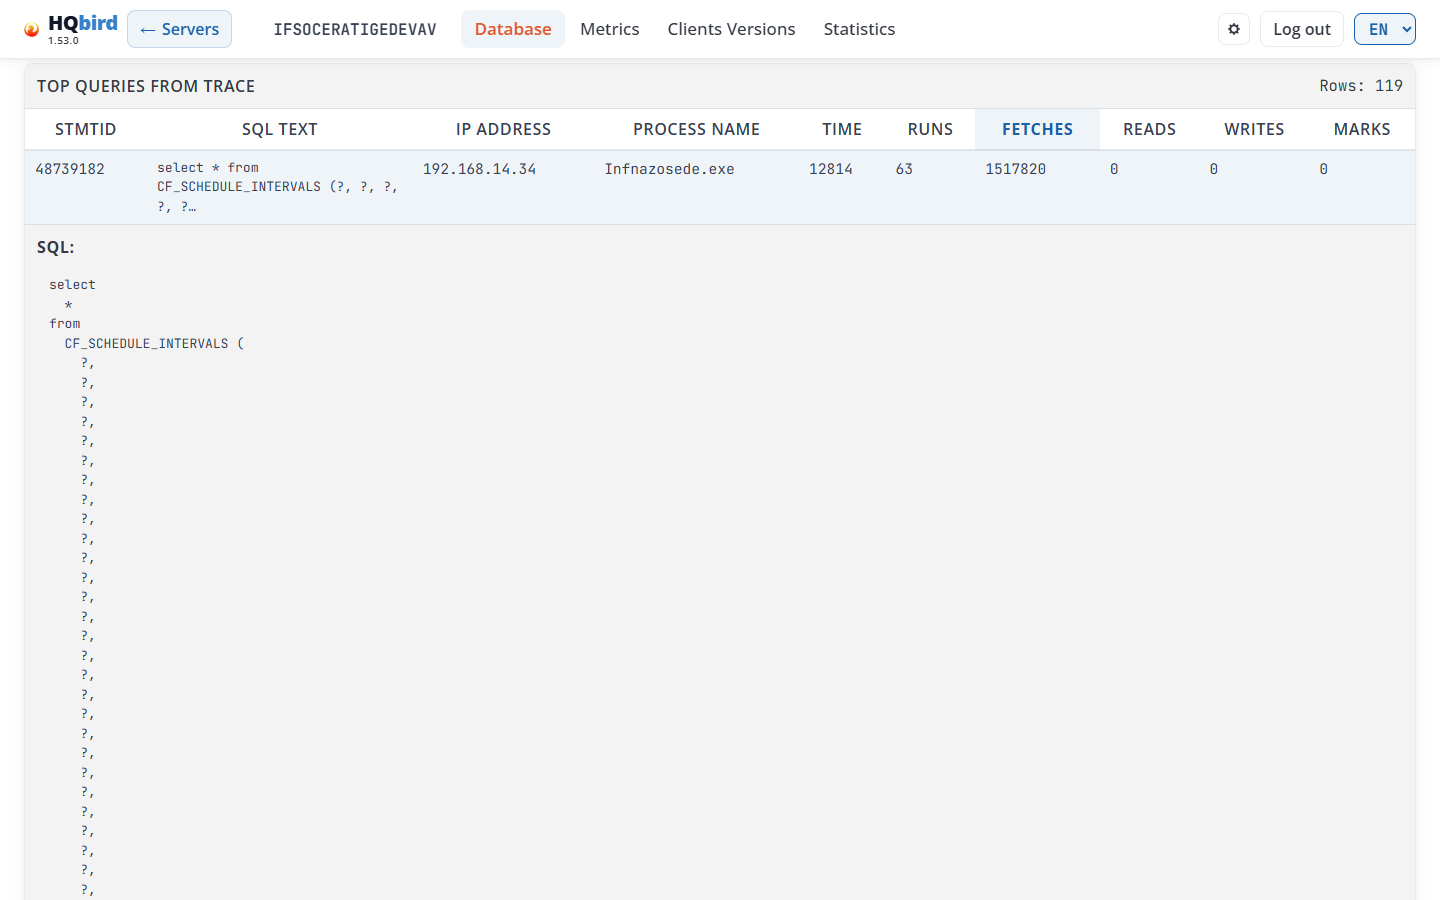
Top queries from trace: the heaviest statements of that minute, sorted by Fetches. Point at a header to see its hint.
| Column | What it shows |
|---|---|
| StmtID | The statement id. |
| SQL Text | The start of the SQL text. |
| IP Address | The client address. |
| Process Name | The client program. |
| Time | The total time of all runs of this statement. |
| Runs | How many times it ran in this minute. |
| Fetches, Reads, Writes, Marks | The totals of all runs in this minute. |
Click a row to see the full SQL text, the PLAN and the PARAMETERS. Copy SQL copies the text; Copy SQL with parameters shows when the statement has parameters.
Connections: every attachment in that minute, sorted by Fetches.
| Column | What it shows |
|---|---|
| AttachID | The attachment id. |
| Process Name, IP Address, Process ID | The client program, its address and its process id. |
| Transactions | Completed transactions of the attachment. |
| Act.Tran | Active transactions. |
| Prepared, Executed, Active | Prepared, executed and active statements. |
| Fetched Rows | Rows fetched by completed statements in this minute. |
| Time | Execution time of completed statements in this minute. |
| Errors | Errors in this minute. |
| Fetches, Reads, Marks, Writes | Page operations of completed statements in this minute. |
Messages you may see:
| Message | What it means |
|---|---|
| Loading… | The chart is loading. |
| No data | No data for this database in the range. |
| Loading trace…, Loading connections… | The tables for the selected minute are loading. |
| lwmmon files are missing for this minute. | The agent has no connection data for this minute. Select another minute. |
When the trace has no statements for the minute, the trace table does not show.
Transaction counters
Firebird keeps four transaction numbers. They always grow, and they keep this order:

- Next-Oat is Next transaction minus Oldest active. A line that climbs all the time means that one transaction stays open for a long time. Find it in the Connections table or in the health report (long transactions).
- OST − OIT is Oldest snapshot minus Oldest interesting. It grows when garbage collection falls behind, for example when a sweep is needed.
- Active Δ is the number of new transactions per minute.
5. Database pages
Every database has four pages: Database, Metrics, Clients Versions
and Statistics. To open them, click Details next to a database in the
dashboard Databases table. The gstat chips in the same
table open the Statistics page directly.
All four pages have the same header:
- The logo and the version (
1.53.0). - ← Servers: back to the Servers page.
- The server name, for example
SRV. It opens the dashboard of this server. - The menu: Database, Metrics, Clients Versions, Statistics. The open page is shown in orange.
- The gear icon (Settings), Log out and the language list.
- The breadcrumb line:
Servers › SRV › employeeon the Database page. The other pages add their name, for exampleServers › SRV › employee › Metrics.
You can bookmark these pages. The address keeps the database, the date and the time range.
Database
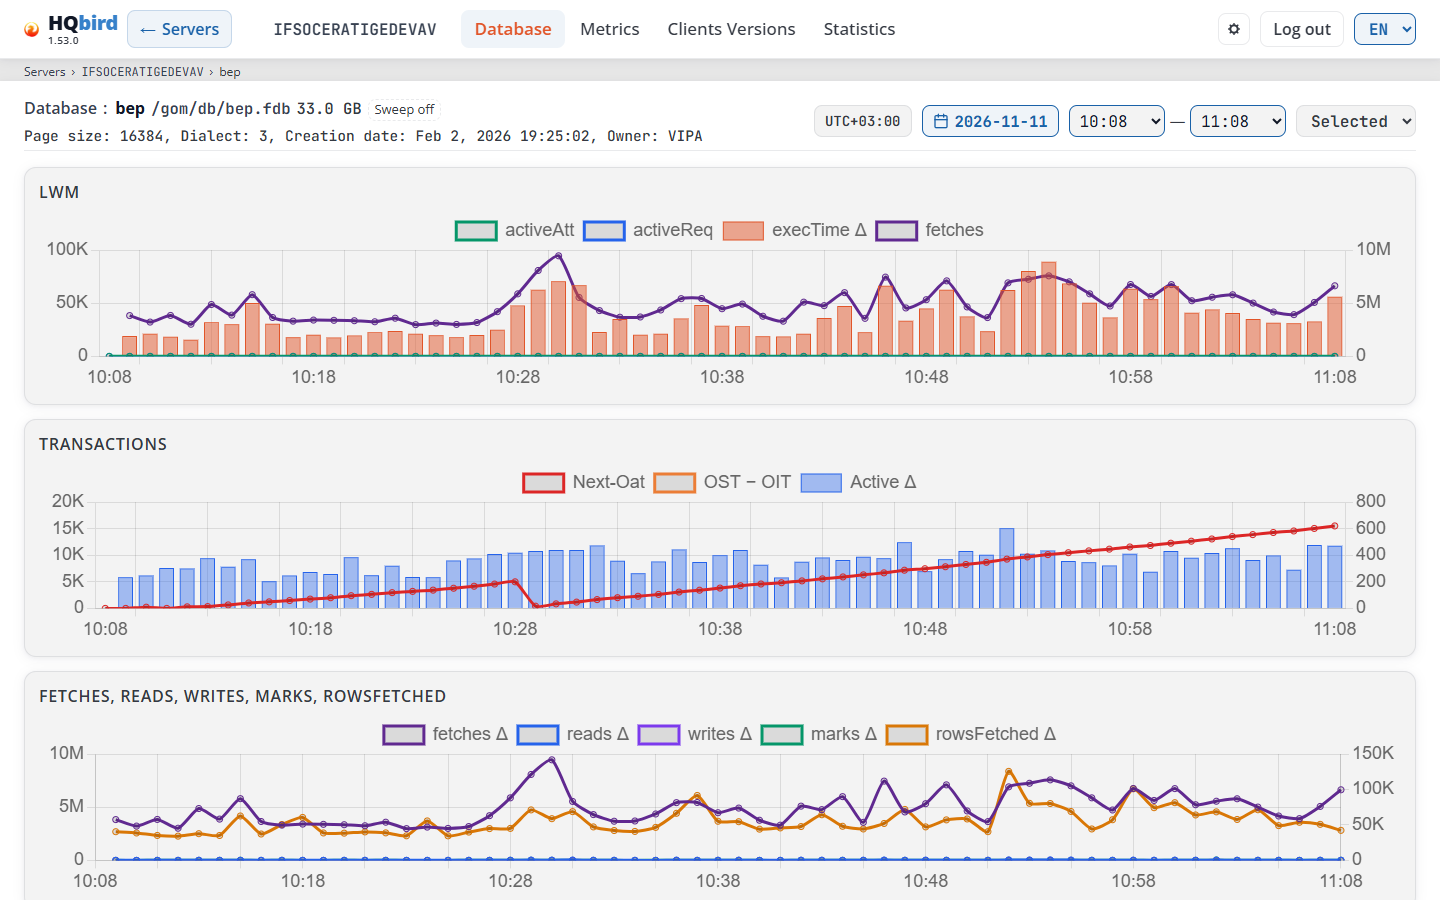
What you see
- The header and the breadcrumb line.
- The database line: Database:, the database name, the state badges (only
when the database has a state), the path, the size and the Sweep chip.
For example:
employee /data/employee.fdb 58.1 GB Sweep off. The size is in MB below 1024 MB and in GB above. Point at the size to see the exact number of bytes. - The second line: Page size, Dialect, Creation date, Owner
and Security DB. Owner shows only when the agent knows it.
Security DB shows only when the database does not use the default
security database:
selfmeans the database checks logins itself,sec: …means it uses another security database. - The time bar: the time zone of the server data (see Time and time zone), the date button, From — To, and the preset list: Last 1h (default), Last 6h, Last 12h, Full day, Selected. After you click a chart, Selected minute: HH:MM also shows here.
- Four charts per minute for the selected range.
The size, the state badges and the Sweep chip show the newest values up to the end of the selected range. So an earlier day shows the values of that day.
State badges and Sweep
They mean the same as in the dashboard Databases table.
| Color | Badges |
|---|---|
| Red | Full shutdown |
| Amber | Single-user shutdown, Multi-user shutdown, Shutdown (maintenance), nbackup lock |
| Blue | nbackup merge, Replica (read-only), Replica (read-write), Replica, Read only |
- The state comes from the database header or from
MON$DATABASE, whichever is newer. Point at a badge to see the source and the time: From the database header, 01:00 or From MON$DATABASE, 01:00. - If the data is more than 15 minutes older than the end of the range, the badge is paler and the tooltip ends with (stale).
- Sweep 20000: the automatic sweep interval from the database header, in transactions. Sweep off (dashed frame): the sweep interval is 0, so automatic sweep is off. The chip needs fbagent 2.91.0 or later.
Charts
| Chart | Series |
|---|---|
| LWM | activeAtt, activeReq, execTime Δ, fetches |
| Transactions | Next-Oat, OST − OIT, Active Δ (the same as on the dashboard, see Transaction counters) |
| Fetches, reads, writes, marks, rowsFetched | fetches Δ, reads Δ, writes Δ, marks Δ, rowsFetched Δ: page operations per minute |
| Requests: prepReq Δ, execReq Δ, activeReq, rowsFetched Δ | prepared (Δ), prepared now, execReq Δ, activeReq, rowsFetched Δ |
Δ means the change from the previous minute. A gap means the counter was reset, for example after a Firebird restart, or that the agent was updated to new counters in that minute (fbagent 2.67.0 and later also count the open connections). When the agent reports that the database’s LWM entry was recreated, the minute shows the work since then instead of a gap.
prepared (Δ) is the old prepReq counter (agents before 2.67.0): statements prepared per minute. prepared now comes from newer agents: statements prepared at that moment. A day of an agent update shows the first line before the update and the second after it.
Tips:
- The server name in the header opens the dashboard with the same date and time range.
- Changing the date, the range or the preset clears the selected minute.
Top queries and connections
Click a chart to select a minute. The console takes the nearest minute with data and marks it with a vertical line on all four charts. Two tables appear under the charts.
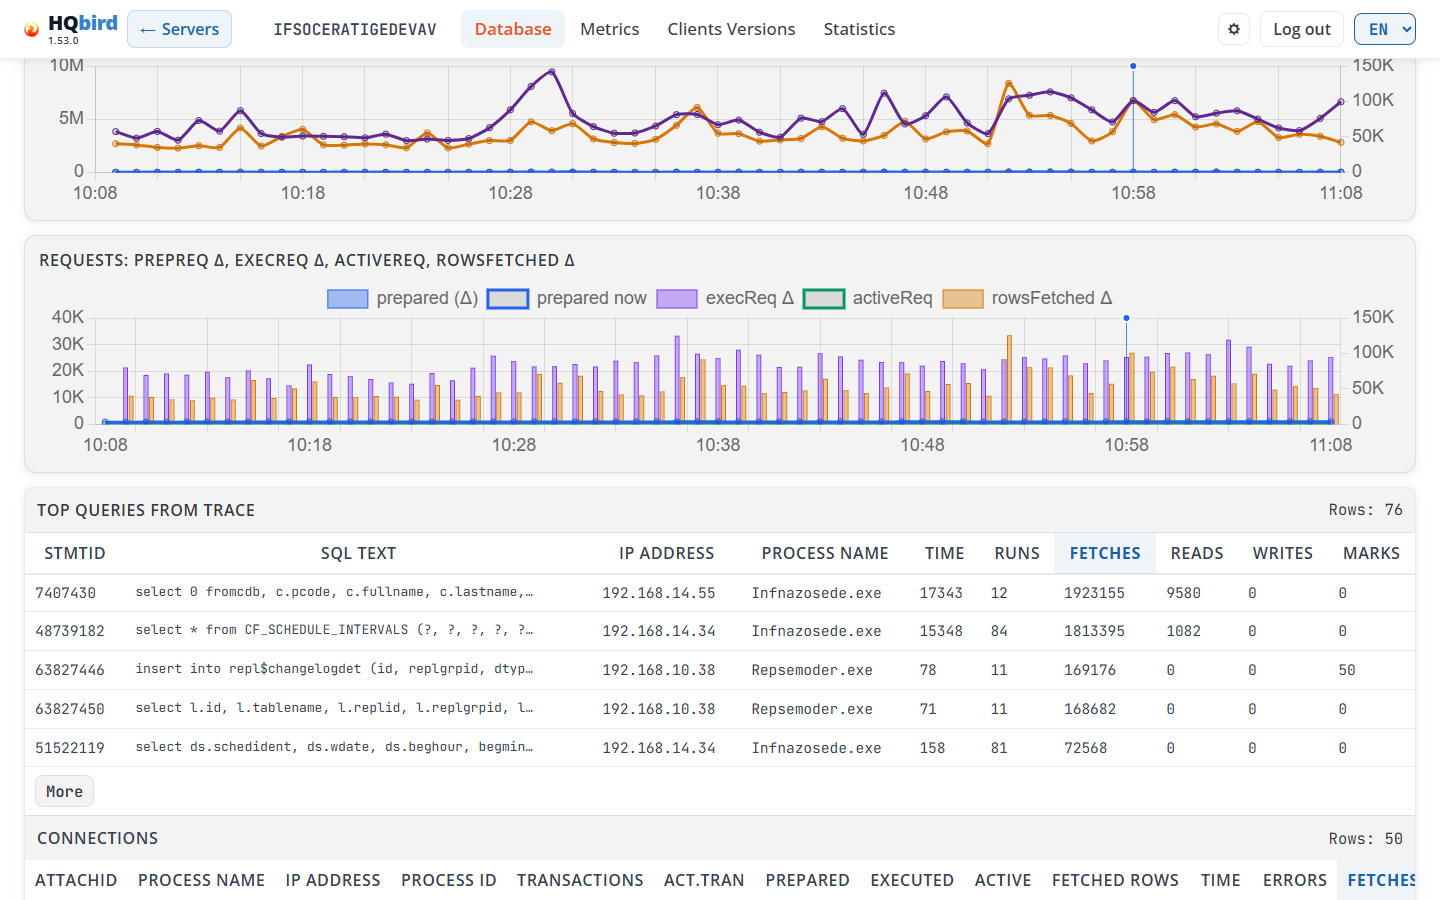
What you see
- Top queries from trace and its row count (Rows: n). One row per statement from the trace in this minute.
- Connections and its row count. One row per attachment (from the LWM data of this minute).
Both tables work the same way:
- They show the first 5 rows. More shows all rows, Less shows 5 again.
- They are sorted by Fetches, largest first. Click a column header to sort by it. The first click on a number column sorts the largest values first. A second click reverses the order. The sorted column is blue.
- Wide tables scroll to the right.
Top queries from trace columns:
| Column | What it shows |
|---|---|
| StmtID | The statement id from the trace. |
| SQL Text | The start of the statement. Click the row to open it. |
| IP Address | The client address, for example 192.168.0.10. |
| Process Name | The client program. |
| Time | The total elapsed time of all such queries in this minute. |
| Runs | How many times this query ran in this minute. |
| Fetches, Reads, Writes, Marks | Totals for all runs in this minute. |
Click a query row to open it. A second click closes it. Only one row is open at a time.
- SQL: the full statement text.
- PLAN: the plan that Firebird used.
NATURALmeans a full table scan. - PARAMETERS: the parameter types and values.
- Copy SQL copies the statement. Copy SQL with parameters shows only when the statement has parameters. In demo mode these buttons are hidden.
Connections columns:
| Column | What it shows |
|---|---|
| AttachID | The attachment id. |
| Process Name, IP Address, Process ID | The client program, its address and its process id. |
| Transactions | Completed transactions in this attachment. |
| Act.Tran | Active transactions. |
| Prepared | Statement preparations. |
| Executed | Executed statements. |
| Active | Active statements. |
| Fetched Rows, Time, Errors, Fetches, Reads, Marks, Writes | Values of the statements that completed in this minute in this connection. |
A value the agent did not report shows as —. For example, sort by Act.Tran to find the connections that keep transactions open.
Messages you may see
| Message | What it means |
|---|---|
| Loading trace… / Loading connections… | The console loads the table. |
| No trace data for this minute. | The trace has no statements for this database in this minute. Select another minute. |
| No connections data for this minute. | The LWM data of this minute has no attachments. |
| lwmmon files are missing for this minute. | The agent did not collect connection data at that time. |
| Trace error: … / Connections error: … | The data could not be loaded. The text shows the reason. |
Metrics
Detailed tables from one MON$ snapshot of the database.
- Select a date and a time range.
- Click a snapshot time button. The newest one is selected by default.
What you see
- The header and the breadcrumb line (
Servers › SRV › employee › Metrics). - The time bar: the date button, From — To and the preset list. The page reads the snapshots of the day of the range end.
- A notice box, only when the page has to explain missing data (see the messages below).
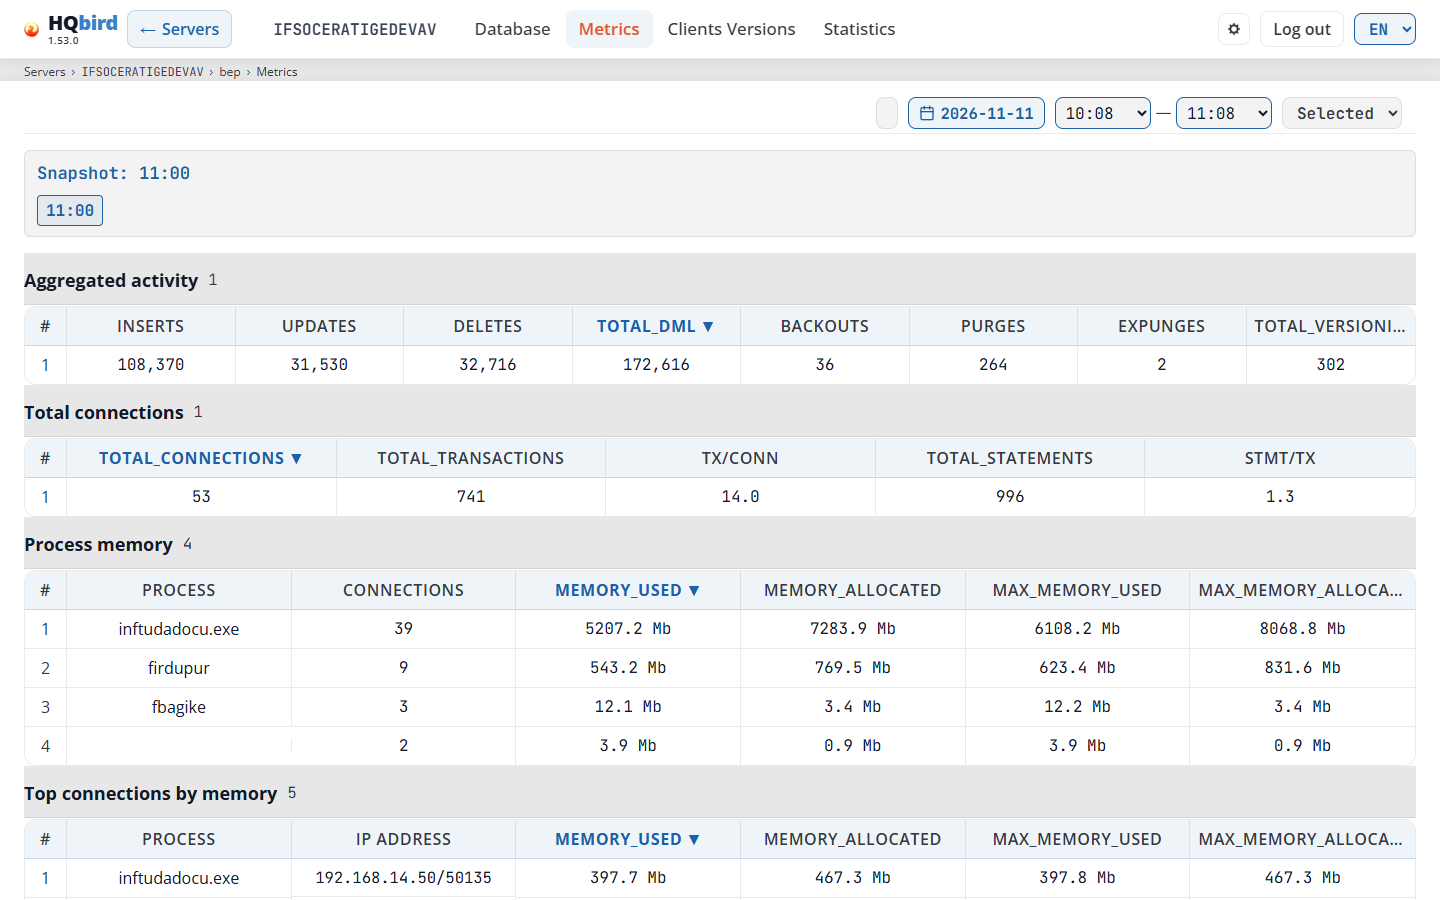
- The snapshot panel: Snapshot: 01:00 (the selected time) and one button
per snapshot time. The selected button is blue. A button with an orange
frame marks a snapshot where the agent could not read
MON$. Point at it to see the agent’s message. - Five tables. Each table title shows the number of rows.
| Table | Columns | What it shows |
|---|---|---|
| Aggregated activity | #, inserts, updates, deletes, total_dml, backouts, purges, expunges, total_versioning | Record operations of the whole database (MON$RECORD_STATS). |
| Total connections | total_connections, total_transactions, tx/conn, total_statements, stmt/tx | Connections, transactions and statements at the snapshot time. |
| Process memory | Process, Connections, memory_used, memory_allocated, max_memory_used, max_memory_allocated | Memory per client program. Connections of one program are added up. |
| Top connections by memory | Process, IP address, the same four memory columns | The 5 connections that use the most memory. |
| Top connections by load | Process, IP address, inserts, updates, deletes, total_dml, statement_count | The 5 connections with the most changes and the 5 with the most statements. |
- Click a column header to sort. The sorted column shows ▼ or ▲. Number columns sort the largest first, Process and IP address sort A to Z.
- Memory is shown in MB, for example 139.3 Mb.
- An empty Process cell means the connection did not report its program.
Why a database has no Metrics data
The agent reads MON$ every hour, and only for the databases that are active
(have connections) at that moment: up to 10 per server by default. The agent
setting firebird.database_metrics.max_active_databases changes the limit
(-1 means no limit). The databases listed in
conf/database_metrics_targets.json are always read first, when they are
active. Security databases are not read.
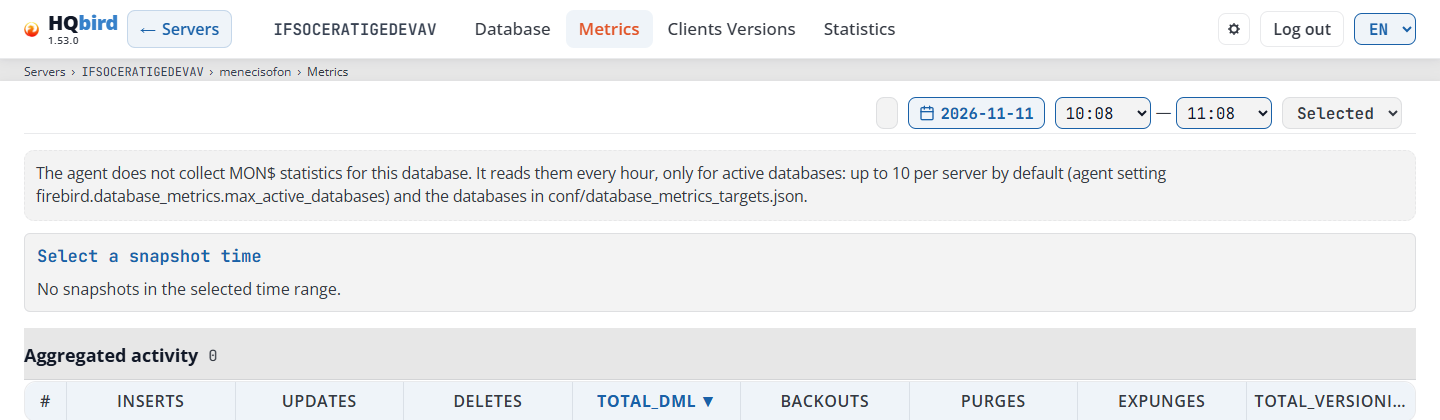
On a server with many small databases, most of them have no Metrics data, or data only for some hours. This is expected. The page then shows a notice:
Messages you may see
| Message | What it means |
|---|---|
| The agent does not collect MON$ statistics for this database. … | The agent has no MON$ data for this database on any day. See the limit above. |
| The agent read this database at other times. Choose another date or a longer range. … | There is MON$ data for this database, but not in the selected range. |
| The agent could not read MON$ at 01:00: … | The agent tried, but could not attach or ran out of time. The text shows the agent’s message, for example record_stats: context deadline exceeded. |
| Select a snapshot time / No snapshots in the selected time range. | The range has no snapshots. Choose another date or a longer range. |
| No data for the selected snapshot. | The table has no rows for this snapshot. A snapshot with an orange frame shows this in its tables. |
| Failed to load metrics: … | The data could not be loaded. The text shows the reason. |
Clients Versions
The Firebird client versions that connect to this database, and how many connections each one has.
What you see
- The header and the breadcrumb line
(
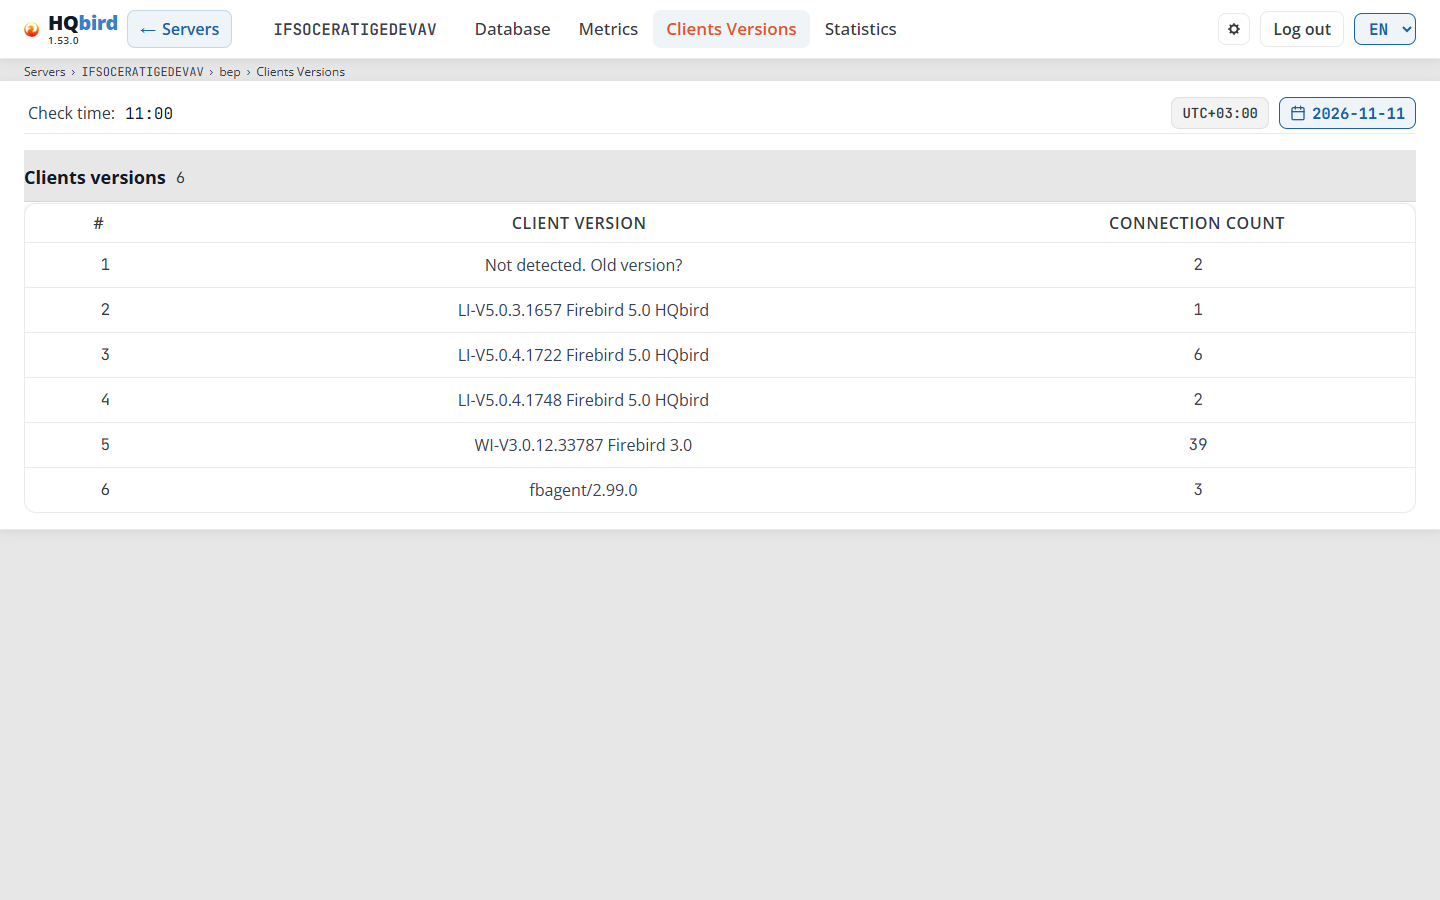
Servers › SRV › employee › Clients Versions). - Check time: the time when the agent read the client versions, or —.
- The time zone of Check time (see Time and time zone) and the date button. The calendar offers only the days with client version data. The newest day opens by default.
- The Clients versions table and its row count.
| Column | What it shows |
|---|---|
| # | The row number. |
| Client version | The version string that the client reported, for example WI-V5.0.1.1469 Firebird 5.0. Not detected. Old version? means the client did not report its version. This is usually an old client library. A row such as fbagent/2.93.0 counts the connections of the agent itself. |
| Connection count | The number of connections with this version. |
Click Connection count to sort: the first click sorts the largest first, the second click the smallest first, the third click returns the original order.
The agent reads client versions once a day (11:00 by default), for the same databases as Metrics (see Why a database has no Metrics data).
Messages you may see
| Message | What it means |
|---|---|
| The agent does not collect client versions for this database. … | The agent has never read client versions for this database. |
| The agent could not read client versions at 11:00: … | The agent tried and failed. The text shows the reason. skipped means Firebird 2.5, which has no MON$CLIENT_VERSION. |
| No data for the selected date. | The selected day has no rows. Choose another date. |
| No ClientVersions files for this database. | Shown in the calendar: there are no days to choose. |
| Failed to load client versions: … / Failed to load dates: … | The data could not be loaded. The text shows the reason. |
6. Statistics: gstat reports and trends
The Statistics page analyzes the gstat files that the agent collects for
the database. The agent runs gstat once a day (02:00 by default). On a server
with many databases, the agent also limits the number of databases per run, so
some databases have no gstat files.
The page has two buttons at the top: Report and Trends. The breadcrumb
line follows the open tab: Servers › SRV › employee › Statistics › Report or
… › Statistics › Trends. The address keeps the selected file, the tab and the
trend settings, so you can bookmark a report.
The gstat chips in the dashboard Databases table open
this page: the critical and warning chips open the Analysis and
Recommendations tab, and +25% opens Trends with the Forecasts
tab.
Report
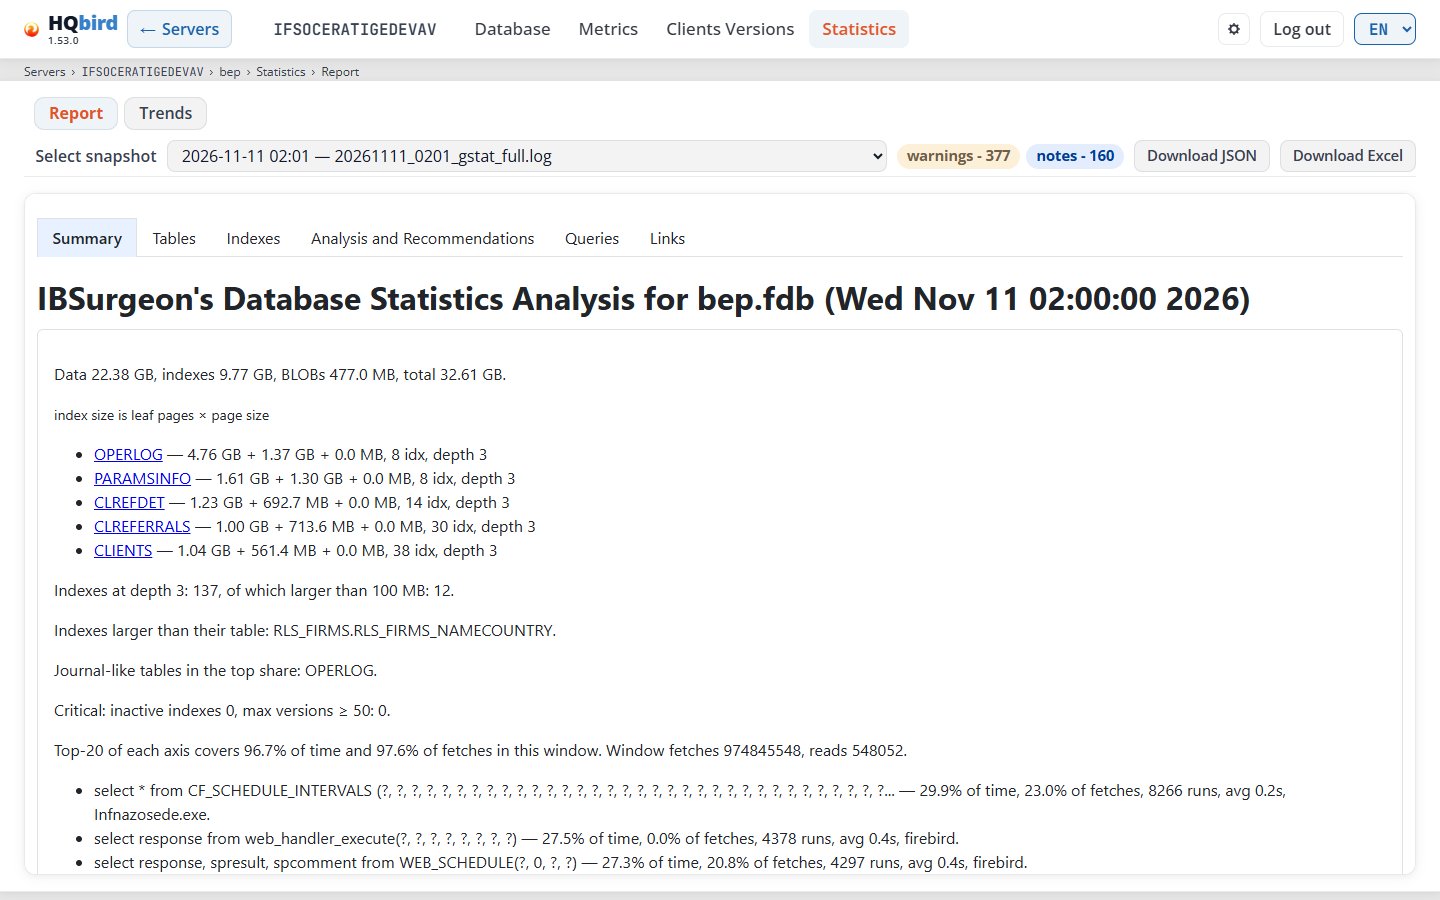
What you see
- The header and the breadcrumb line.
- The Report and Trends buttons. The open one is orange.
- The report bar:
- Select snapshot: the
gstatfiles, newest first. Each item shows the date and the file name. - The badges: critical - {n} (red), warnings - {n} (amber), notes - {n} (blue). A badge with 0 is hidden.
- Download JSON: the measured values.
- Download Excel: the full analysis as an
.xlsxworkbook in the current language.
- Select snapshot: the
- A remarks box, only when the analyzer had remarks about the file.
- The report with its own tabs:
- Summary: the size of data, indexes and BLOBs, the largest tables, the indexes at depth 3, the main findings, and the heaviest queries when they are known.
- Tables and Indexes: one row per table or index.
- Analysis and Recommendations: what is wrong and what to do.
- Queries and Links: only when the agent has performance reports near the snapshot time (see Queries tab).
Tables tab
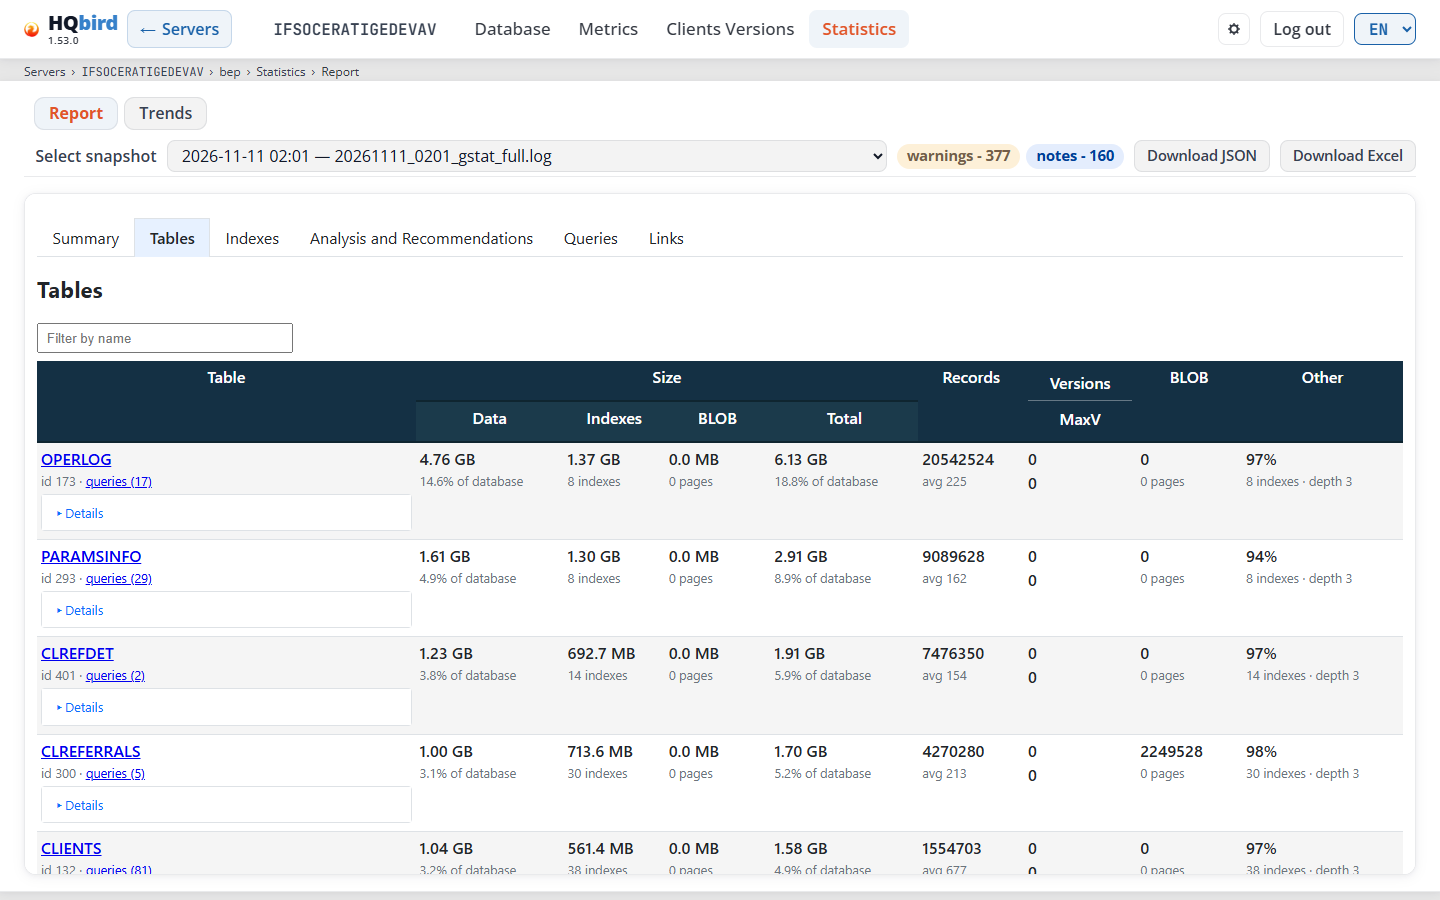
Type in Filter by name to show only matching tables. Click a column header to sort.
| Column | What it shows |
|---|---|
| Table | The table name, its id, a queries (n) link when queries read the table, and Details with more values. |
| Size: Data, Indexes, BLOB, Total | The size of each part. Under it: the share of the database, the number of indexes, the BLOB pages. |
| Records | The record count and the average record length (avg). |
| Versions / MaxV | The number of back versions, and the most versions of one record. |
| BLOB | The number of BLOBs and their pages. |
| Other | The average fill of the data pages, the number of indexes and the largest index depth. |
The Indexes tab has the same filter. Its columns: Index (name, id, queries (n)), Table, Size (with the share of the table data), Structure (depth, pages, low fill) and Key (nodes, distinct values, duplicates, average key length). Rows with depth 4 are yellow. Rows with depth 5 or more are red.
Analysis and Recommendations tab
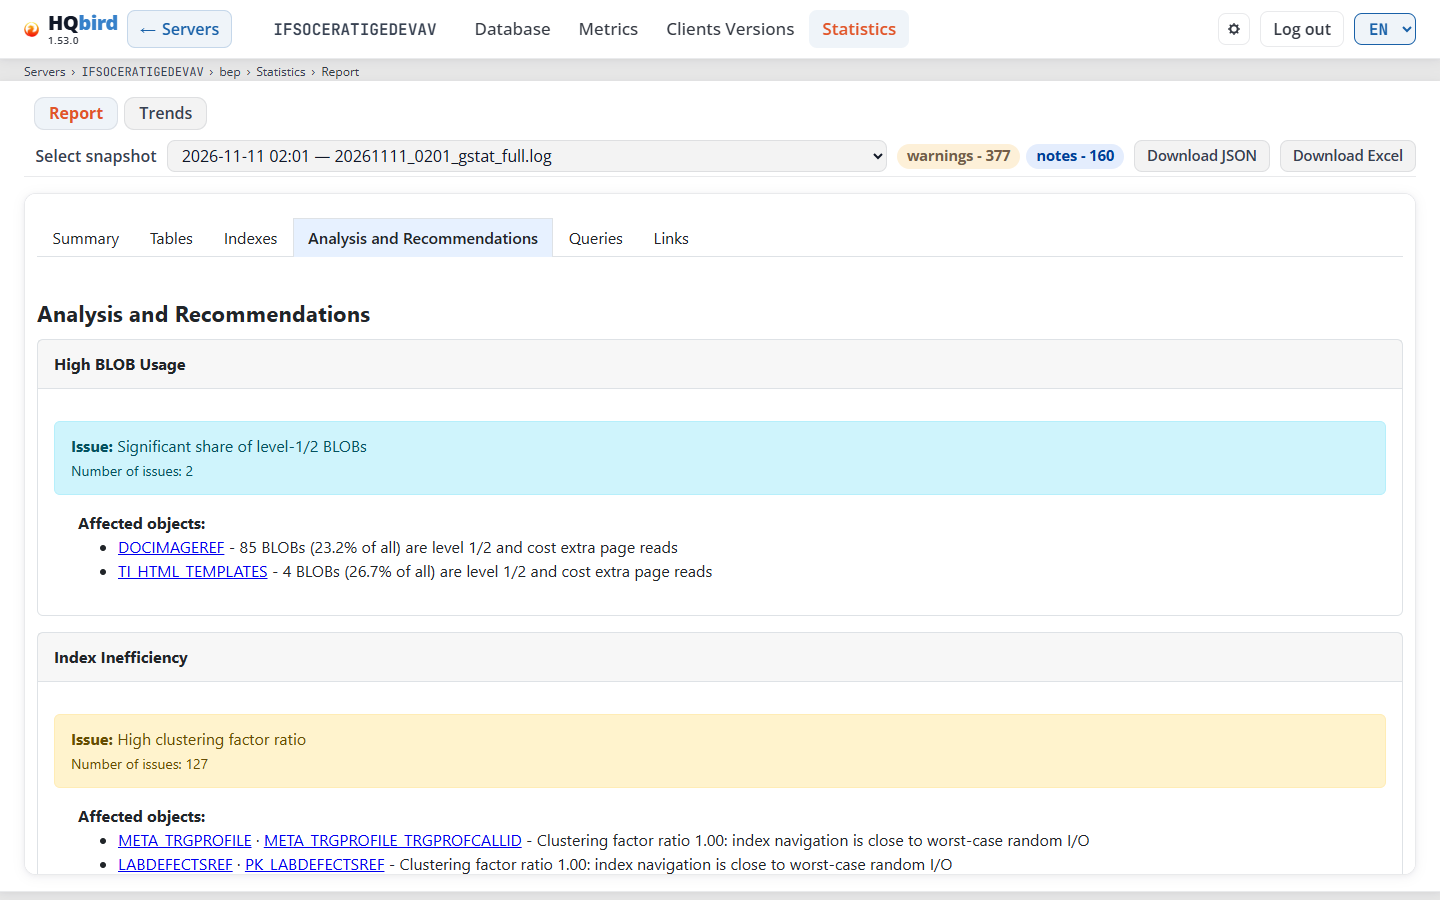
- One card per category, for example High BLOB Usage or Index Inefficiency.
- A colored box per issue: Issue:, the description and Number of issues:. Below it, Affected objects: lists the tables and indexes. Each name is a link.
- A recommendation box: Recommendation:, Rationale:, Impact: and Action:. A long object list shows 3 objects and More (n).
Messages you may see
| Message | What it means |
|---|---|
| No gstat files found | The agent has no gstat file for this database. See the limit in the introduction. |
| Generating report… | The console analyzes the file. Wait. |
| Failed to load report | The file could not be read or analyzed. |
| This snapshot has no database header, so header-based checks were skipped. | The gstat file has no header part. The checks that need it are missing. |
| The analyzer had remarks about this file: | The analyzer’s remarks follow as a list. |
Queries tab
The Queries tab joins the gstat statistics with the queries that ran on the
server. It shows which statements read which tables and indexes, so you can
find the query behind a problem table.
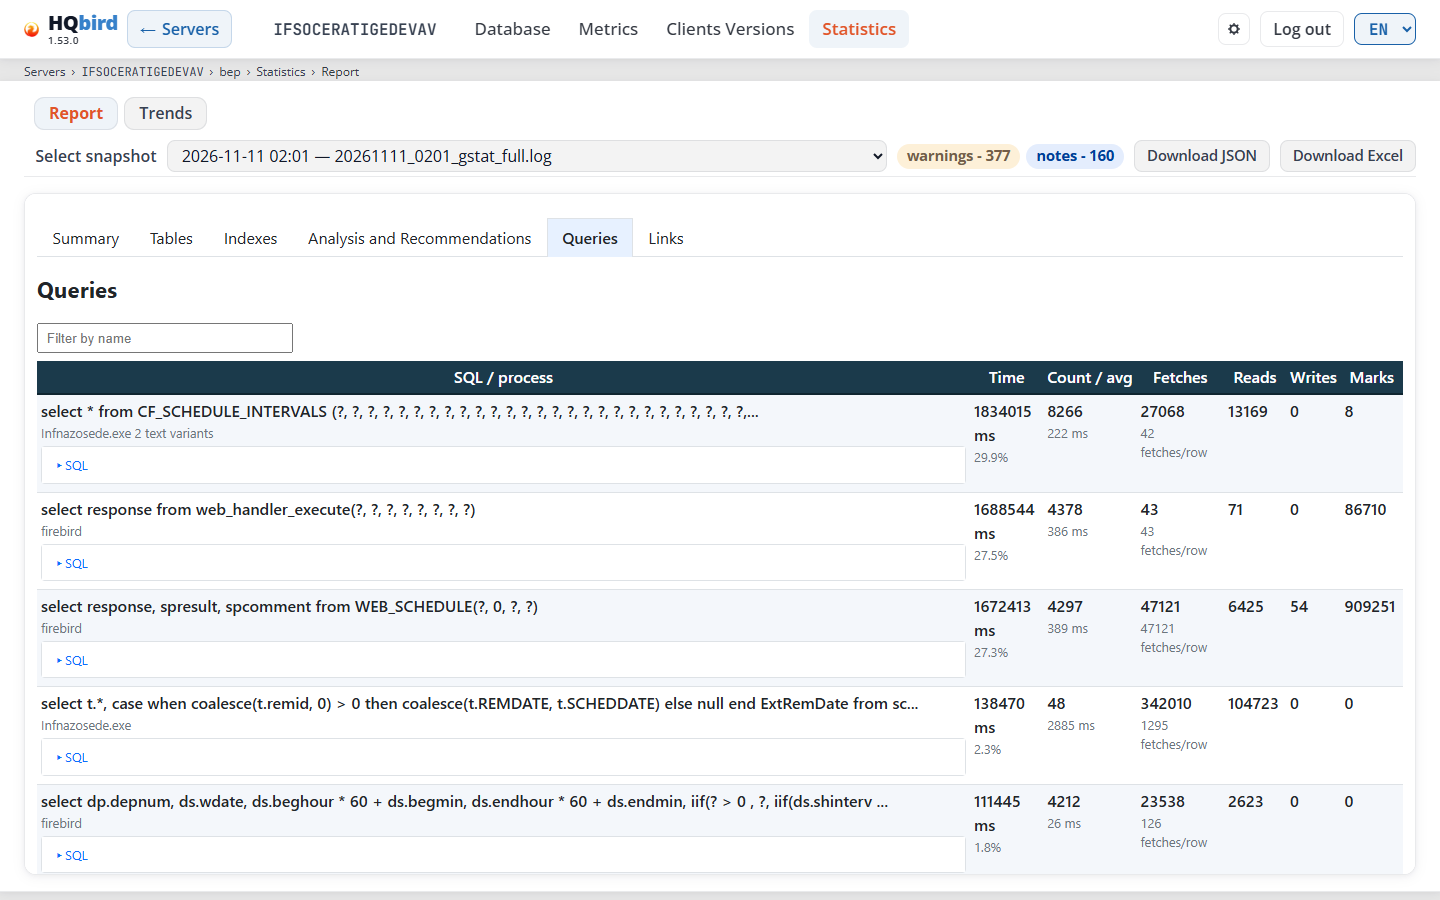
| Column | What it shows |
|---|---|
| SQL / process | The statement, the client program and the number of text variants. SQL opens the full text. |
| Time | The total time in ms and its share of all time. |
| Count / avg | How many times the statement ran, and the average time. |
| Fetches | Total fetches and fetches per row. computed in cache means many fetches but almost no page reads. |
| Reads, Writes, Marks | Totals of page reads, writes and marks. |
- The data comes from the agent’s performance reports (the same data as Perf Report).
- The console uses report windows that end at most 23 hours from the time
of the
gstatsnapshot. Older or newer windows are not used. - Empty, expired or damaged report files are skipped. If no usable window is left, the Queries tab does not appear.
- The performance report covers the whole server. On a server with several databases, the tab can show statements that ran against other databases.
- Filter by name shows only matching statements.
- Links lists tables and indexes with the number of query hits. In the Tables and Indexes tabs, a queries (n) link opens the matching queries.
- The Excel file then also has the sheets Queries, Processes and addresses and Addresses.
Trends
The Trends tab compares the newest snapshots and shows how tables and indexes change over time. It does not use the snapshot selected on the Report tab. The tab loads when you open it the first time.
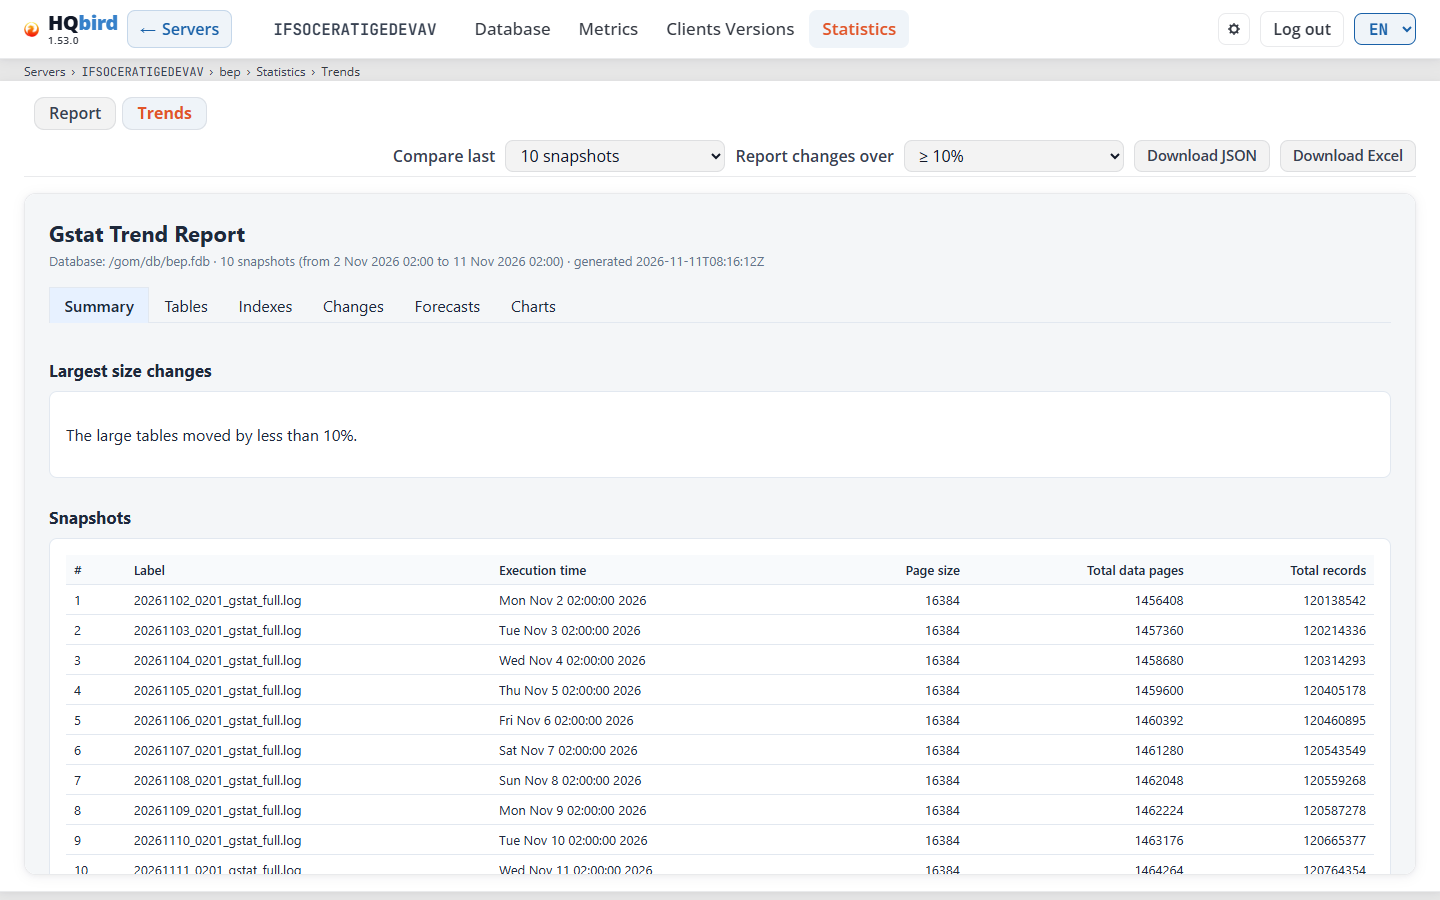
What you see
- The header and the breadcrumb line (ends with Trends).
- The trend bar:
- Compare last: how many snapshots to compare. The list offers 5 snapshots, 10 snapshots, 20 snapshots and 30 snapshots, but only up to the number of files. With fewer than 30 files, the list also offers all of them. The default is 10, or the largest choice when there are fewer files.
- Report changes over: the smallest change to report: ≥ 10% (default), ≥ 2% or ≥ 0.5%. If a quiet database shows nothing, choose a lower value.
- Download JSON and Download Excel, as on the Report tab.
- The trend report: Gstat Trend Report, the database, the number of
snapshots, their dates, and the time the report was made. Its tabs:
- Summary: Largest size changes (Object, Property, Change, Change %) and Snapshots (Label, Execution time, Page size, Total data pages, Total records).
- Tables and Indexes: the values of each object in each snapshot.
- Changes: every change above the chosen limit, with the first and the last value and the level.
- Forecasts: Growth Forecasts (reaching +25%): the current size, the growth per day, and the date when the object grows by 25%. The estimate needs at least three snapshots.
- Charts: table sizes, index sizes, total sizes, version counts, and transactions and attachments.
Messages you may see
| Message | What it means |
|---|---|
| No gstat files found | The agent has no gstat file for this database. |
| Comparing snapshots… | The console builds the trend report. |
| A trend report needs at least two snapshots | There is only one gstat file. Wait for the next daily run. |
| Failed to build the trend report | The files could not be compared. |
| Warning: page size or ODS version changed between snapshots - trends may not be directly comparable | Shown in the report. The page size or the ODS version is not the same in all snapshots, for example after a restore. |
| No growth forecasts. | Shown in Forecasts: the report has no forecast for any table or index. |
7. Server tools
These pages open from the menu in the server header: Logs, Configs,
Errors, Conflicts and Perf Report. Every page has ← Servers at
the left of the header and a breadcrumb line under the header, for example
Servers › SRV › Logs. All times are in the server’s time zone (see
Time and time zone).
Logs, Errors and Conflicts filter rows in the same way:
- Include: and Exclude: take one or more parts of words, separated by commas or semicolons. Case does not matter.
- Include keeps a row that has any of the parts. Exclude hides a row that has any of the parts.
Logs
The Firebird logs of the server, with two tabs: Firebird.log and Replication.log. The agent sends the log entries day by day.
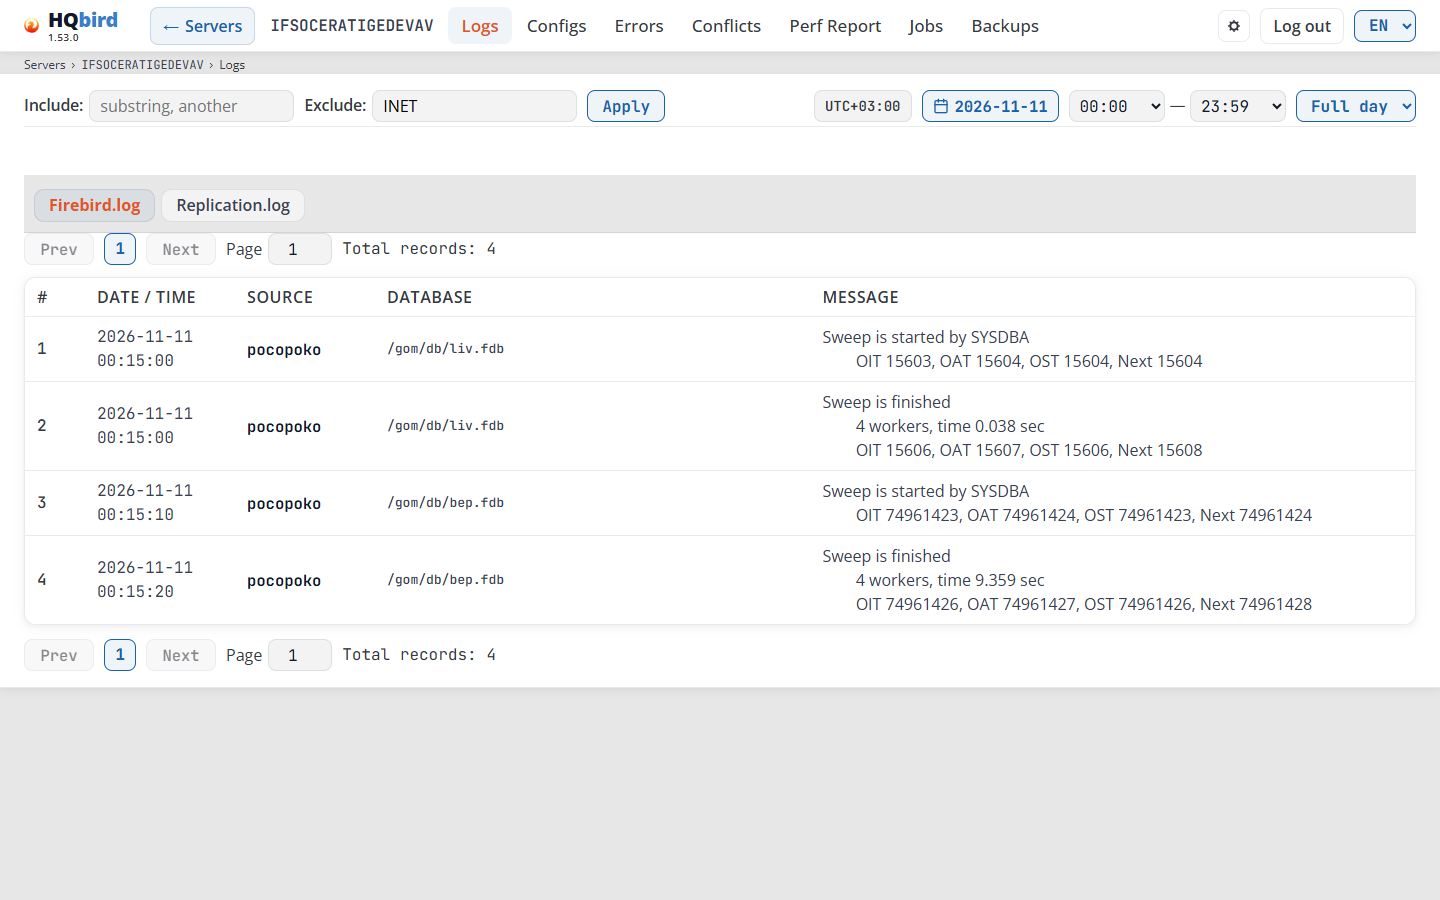
What you see
- The filter line: Include:, Exclude: and Apply (or Enter in a filter field).
- The time bar: the time zone badge, the date button, the start and end time, and the preset list.
- The tabs Firebird.log and Replication.log.
- The page bar: Prev, the page numbers, Next, the Page field and Total records: N. The same bar is also under the table.
- The table of log entries.
Filters. The filters look at the message, the source and the database of
each entry. Click Apply, or press Enter in a filter field, to use
them. On the Firebird.log tab,
Exclude is INET by default: it hides the network messages such as
INET/inet_error. On the Replication.log tab, Exclude is empty. When
you switch the tab, Include is cleared and Exclude gets the default of
that tab again.
Date and time.
- The calendar has the days of both logs. The page opens on the newest day. When you choose another day, the table loads again.
- The preset list sets the range of the day:
- Full day (the default): 00:00–23:59.
- Last 1h: the hour that ends at the newest entry of the day.
- Last 6h: 18:00–23:59.
- Last 12h: 12:00–23:59.
- Selected: the range that you set by hand.
- A preset loads the table at once. After you change the start or end time by hand, click Apply.
The table
| Column | What it shows |
|---|---|
# |
The number of the entry in the result. |
| Date / Time | The date and time of the entry. |
| Source | The computer name in the entry. |
| Database | The database of the entry, or — when the entry names none. |
| Status | Only on Replication.log: the status of the entry. Click the header to sort by it; click again to reverse the order. |
| Message | The text of the entry. |
- A row is red when its message has
bugcheck,internal consistency check,abnormal terminationoroperating system. Read these entries first. - The table has 100 entries per page. It opens on the last page, with the newest entries. To go to a page, type its number in the Page field and press Enter. A sorted table opens on page 1.
Messages you may see
| Message | What it means |
|---|---|
| No entries for the selected date and time range. | No entry matches the day, the range and the filters. Choose Full day or clear the filters. |
| firebird.log has no entries yet. The server has no such log, or it is empty. | The agent has sent no day of this log. The same message names replication.log on the other tab. A server without replication has no replication log. |
| No dates in log | The calendar has no days: the agent has sent no log yet. |
| Failed to load dates: … / Failed to load logs: … | The console could not read the data. The text after the colon gives the reason. |
Configs
The saved copies of databases.conf, firebird.conf and replication.conf.
The agent copies a file each time it changes. Choose a copy in each list to see
the settings at different times.
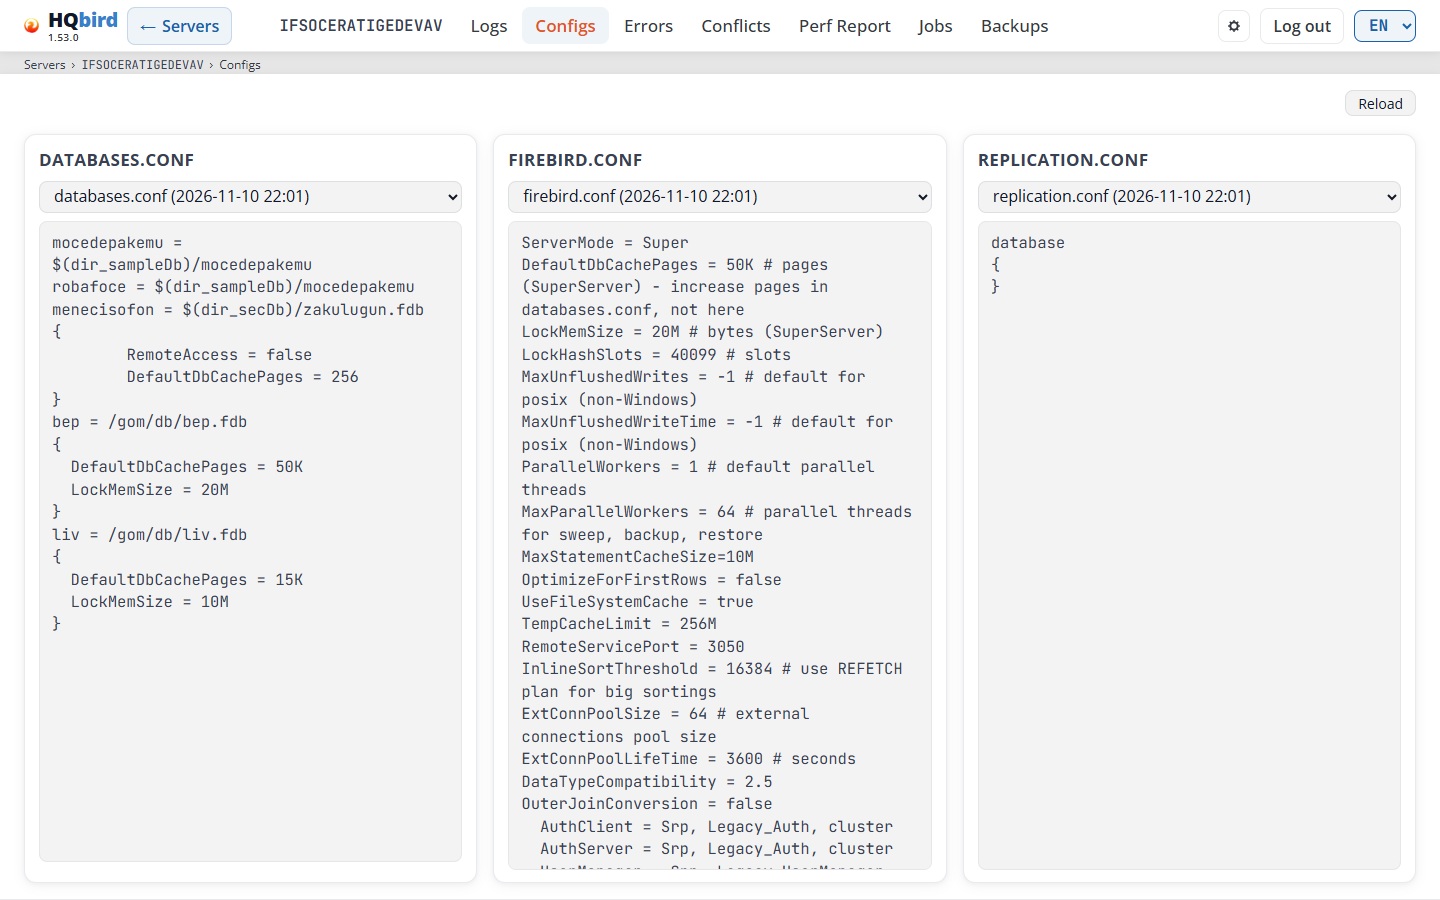
What you see
- Reload at the top right. It reads the newest copies of the files again. The agent copies a changed file within a minute, so after a hand edit on the server, wait a minute and click Reload.
- Three panels: databases.conf, firebird.conf and replication.conf. Each panel has a list of copies and the file text under it.
- The Edit button on the databases.conf panel (not in demo mode, so it is not in the picture).
- Under the databases.conf panel: the list of problems in the chosen copy. It shows only when the copy has problems.
- Each item in a list is the file name and the time of the copy, for example
databases.conf (2026-10-27 13:39). The newest copy is first. - On a desktop window the three panels fill the window to the bottom edge, and each panel scrolls inside. The problem list takes at most a quarter of the window height. On a narrow window the panels are in one column.
Problems in databases.conf. The console checks the syntax the way Firebird
reads the file. It also checks every parameter in a per-database block against
what that Firebird version allows per database. Each problem is one line:
Line 12: <message>. An error line is red, a warning line is amber. When the
braces { } do not match, the file text has a red background.
The console reads the Firebird version from the agent’s data. When it cannot
find the version, it checks against all versions and warns that the version is
unknown. A parameter name with a typo of one or two letters gets a hint, for
example unknown parameter "DefaultDBCachPages" — did you mean
"DefaultDbCachePages"?.
The Edit button opens the databases.conf editor. The other two panels stay read-only. The button shows only when all of these are true:
- Demo mode is off.
- The console can open the file of this server:
- Local mode (the console runs on the machine with the agent): the agent answers on its Local API.
- Remote mode: the administrator set up configuration delivery
(
goafts_push_enabledand thegoafts_admin_*keys), goafts answers, and there is a file to start from. That is a file sent to this server before, or at least one copy ofdatabases.conffrom the agent.
- You may save the file:
- Local mode: the single user mode, an administrator, or an account with the right May push configuration to agents.
- Remote mode: an account with the right May push configuration to agents (see Users). An administrator needs this right too.
If one server has no Edit button in remote mode, check three things: the
agent has sent no databases.conf copy yet (the list says No files), your
account has no push right, or goafts does not answer.
Messages you may see
| Message | What it means |
|---|---|
| No files | The agent has sent no copy of this file. The list is disabled. |
| Error: … | The console could not read the copies. The text gives the reason. |
| "}" without an opened block and other syntax messages | Firebird cannot read the file in this place. Fix the line. |
| parameter “…” cannot be set per database (Firebird …) | This parameter works only in firebird.conf. Firebird ignores it in the block. |
| alias “…” is also defined on line … | The same alias is in the file twice. |
| path … has more than one parameter block: … | Firebird uses only one of the blocks. |
| include is not checked: … (warning) | The console does not open included files. |
| Firebird version is unknown — parameters were checked against all versions (warning) | The agent sent no Firebird version. |
| the file contains binary data | The file is not a text file. |
databases.conf editor
The editor shows databases.conf as a list of database paths. Each path has
its aliases and at most one parameter block. On Firebird 2.5 the file is
aliases.conf: the page names it so and shows it in the Text view only (see
Firebird 2.5: aliases.conf below).
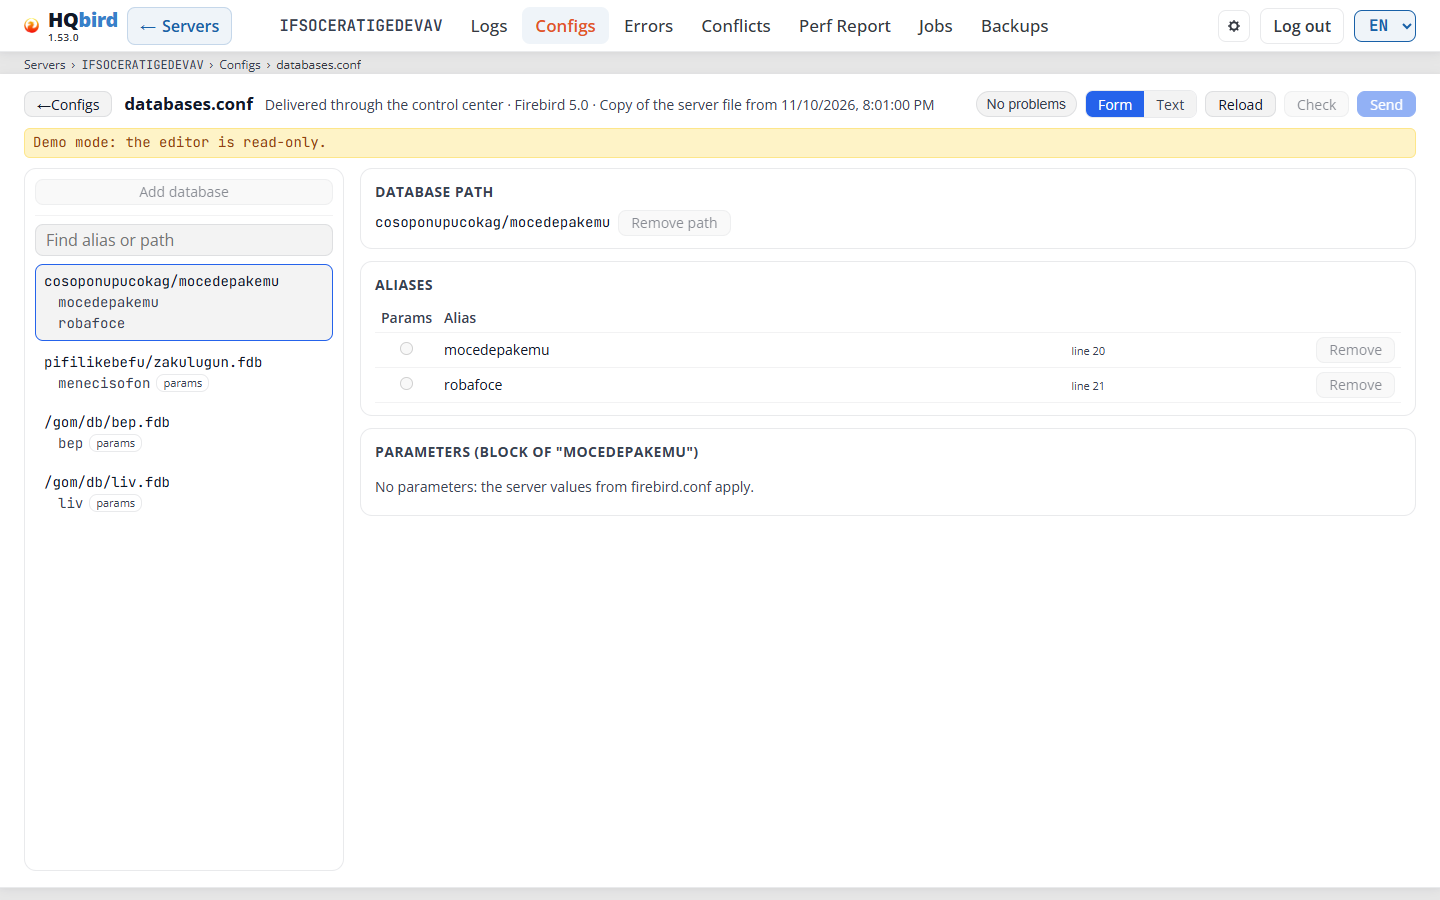
What you see
- The header line:
- ← Configs goes back to the Configs page. With unsaved changes it asks first: “Leave the page? Unsaved changes are lost.”
- The title databases.conf and the source line: File: <path> in local mode, Delivered through the control center in remote mode. Then the Firebird version and, in remote mode, Copy of the server file from <time> or the Last delivery result.
- Unsaved changes (amber) appears after your first change.
- At the right: the problem button (No problems, or Problems: n: red with errors, amber with warnings only), Form and Text, Reload, Check, and Save (named Send in remote mode).
- A status line for the results of Check and Save, and a warning line when one applies.
- Left: Add database at the top, then Find alias or path, the list of
database paths with their aliases and Included files (the
includelines of the file). - Right: the cards of the selected path.
The path list (left). Find alias or path filters the list. A red dot ● marks a path with errors. Badges mark an alias that holds the parameter block (params), a block that Firebird ignores (ignored) and a repeated alias (duplicate).
Add database. The button is at the top of the path list. In the Text view the same button is above the text, on the left. Both open the Add database dialog:
- Type the Alias and the Database path. Both fields are required:
Add stays disabled while one of them is empty. In local mode the example
in the path field follows the OS of the file path (
C:\db\name.fdbor/db/name.fdb); otherwise it is/db/name.fdb. - Add (or Enter) adds the line to the text on the page. Cancel (or Esc) closes the dialog.
- When the console refuses the entry, the dialog stays open with your values and shows why: the alias exists already, the path is already in the file, the alias or the path has characters the file cannot hold, or Fix the text first: it has structural errors. (fix the text in the Text view, then try again).
- After Add the Form view selects the new path, and the Text view shows the new line. The page shows Unsaved changes: only Save writes the file.
- The buttons are disabled in demo mode, while a request runs, when the editor cannot open the file and when you may not save it.
The cards (right).
-
Database path: the path. Remove path removes the path and all its aliases, after a question.
-
A warning when the path has two parameter blocks: Firebird uses only one of them. Merge into “<alias>” joins them; Delete the block of “<alias>” removes one.
-
Aliases: every alias of the path.
Column What it shows Params Which alias holds the parameter block. Select another alias to move the block there. Alias The alias name, its line in the file and its badges. Remove Removes the alias, after a question. Type a name in the new alias field and click + Alias to add one.
-
Parameters (block of “<alias>”): the parameters of the block.
Column What it shows Parameter The parameter name. Value The value in the block. firebird.conf The server value from firebird.conf, when it is known.Remove Removes the parameter. To add one, choose a name in the Parameter… list (it has only the parameters that this Firebird version allows per database), type the Value and click + Parameter. An empty value means the server value applies.
DatabaseAccessis not in the list: Firebird ignores it inside a block. A file that sets it in a block fails Check; set it infirebird.conf. -
Ignored block of “<alias>”: a block that Firebird does not use.
Form and Text. Form and Text switch between this view and the raw file. Every change in the form changes the text, and comments and line endings stay. When the form cannot read the file, fix it in the Text view.
Firebird 2.5: aliases.conf. Firebird 2.5 keeps its aliases in
aliases.conf: one alias = path line each, with no parameter blocks. For
this version the title of the page says aliases.conf, the editor opens
the Text view, and Form and Text are not shown. Add database works
there too. When the console does not know the Firebird version, the Form view
stays available.
Reload reads the file from the server again. If you have unsaved changes, the editor asks first. When you come back to the tab, or go back to the page in the browser, and the file changed on the server, the editor reads it again by itself (only when you have no unsaved changes). On a desktop window the list, the form and the text fill the window to the bottom edge and scroll inside.
Check and Save.
-
A repeated alias and a second parameter block on one path are errors. The console finds them before the file goes to the agent, so an older agent cannot save such a file either.
-
Check validates the file and writes nothing. Save is disabled while the file has errors (tooltip Fix the errors first) and when you may not save (tooltip You have no right to change this file).
-
Local mode: the editor opens the live file. Save sends it to the agent. The agent validates it again, keeps a backup beside the file and refuses the save if the file changed meanwhile. Then the editor keeps your text and offers Reload. This needs fbagent 2.77 or newer. fbagent 2.83 or newer keeps one backup per editing session, not one per Save, and a Save that changes nothing writes nothing.
-
Remote mode: the editor opens the copy that goafts holds. Before the first save it opens the newest copy from the agent:
- fbagent 2.94.0 or newer sends the file byte for byte, with its comments, empty lines and line endings. The header shows Copy of the server file from <time>.
- An older agent sends the file without comments and empty lines. Then Send first asks whether to continue: the save removes them from the file on the server.
Send stores the file on goafts. The agent takes it at its next sync. It refuses the change when its file changed after the editor opened it. Otherwise it applies the file with a backup and reports back. While a change waits for the agent, the page is read-only. The header shows the result the next time you open the editor.
-
Every save is written to the audit log.
-
In demo mode the editor is read-only: all buttons are disabled.
Messages you may see
| Message | What it means |
|---|---|
| No problems found | Check found nothing. |
| No errors. See the warnings. | You can save. Read the warnings first. |
| The file has errors. / Not saved: the file has errors. | Fix the errors that the problem list shows. |
| Saved. The agent keeps one backup next to the file: the file as it was before this editing session. | Local mode: the agent wrote the file. |
| Sent. The agent applies it within about a minute; the result shows here after its report. | Remote mode: goafts holds the file for the agent. |
| The file changed on the server. Your text stays here: copy it, then reload. | Someone changed the file after you opened it. The editor switches to the Text view. Copy your text, click Reload, then make your change again. |
| The file changed on the server. The page shows the new version. | You had no unsaved changes, so the editor read the new file. |
| The form cannot read this file. Fix it in the Text view. | The file has a syntax error that the form cannot show. |
| Change refused: … / Agent error: … | The agent did not accept the file. The text gives the reason. |
| The agent has not applied the last change yet. Reload the page in a few minutes. | Remote mode: a sent change waits for the agent. The page is read-only until the agent reports. |
| The agent refused the last change: the file on the server changed after the editor opened it. The page shows the current file. Make the change again. | Remote mode: someone changed the file on the server meanwhile. Make your change again on the file that the page shows now. |
| This file is from a snapshot without comments and empty lines. Saving removes them from the file on the server. Continue? | Remote mode with an agent of 2.93.0 or older. Click Cancel to keep the comments; edit the file on the server instead. |
| Editing is not available: … | The console cannot open the file of this server (see the Edit button rules under Configs). |
| The agent has not sent a copy of the file yet. The copy comes after the agent restarts. | Remote mode: goafts has no file for this server and the console has no copy from the agent. Restart the agent, wait for its copy, then open the editor again. |
| Fix the text first: it has structural errors. | In the Add database dialog: the text has an error that the editor cannot work around. Close the dialog and fix the text in the Text view. |
| Demo mode: the editor is read-only. | Turn off demo mode to edit. |
Errors
Firebird errors from the trace: time, attachment ID, error text and database. The same error that repeats is shown as one row with a count.
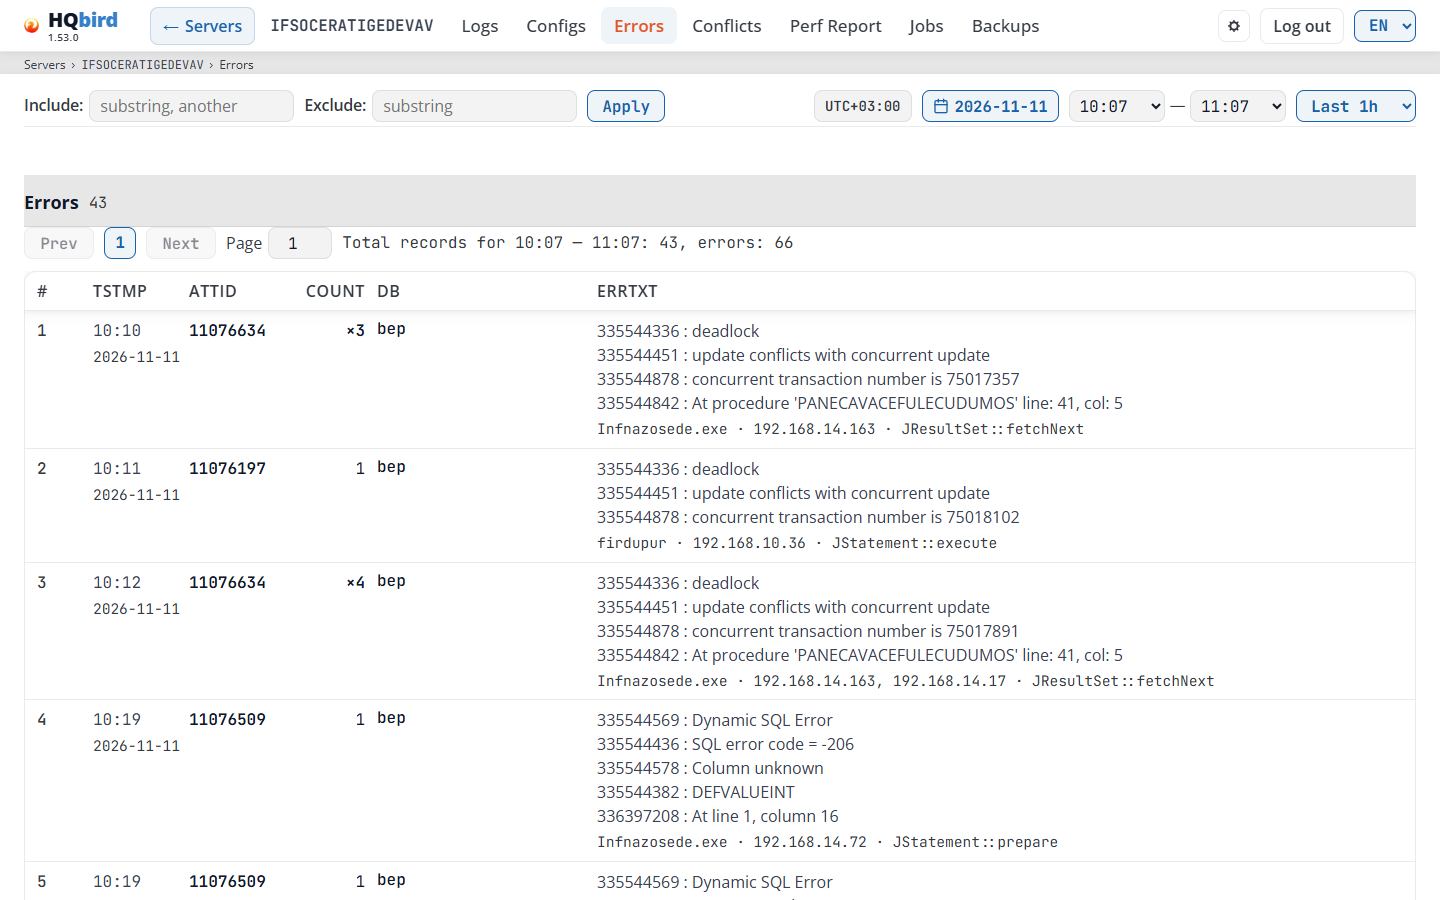
What you see
- The filter line: Include:, Exclude: and Apply. You can also press Enter in a filter field.
- The time bar: the time zone badge, the date button, the start and end time, and the preset list.
- The title Errors with the number of rows, and Export CSV right of it (not in demo mode, so it is not in the picture).
- The page bar: Prev, the page numbers, Next, the Page field and the total line. The same bar is also under the table.
- The table of errors.
Time range. The default is Last 1h: the hour that ends at the latest error of the day. Last 6h is 18:00–23:59, Last 12h is 12:00–23:59, and Full day is 00:00–23:59. The All errors → link in the health report opens the day as Full day.
Filters. The filters look at the error text, the attachment ID, the time, the database, the applications, the addresses and the Firebird function.
The table
| Column | What it shows |
|---|---|
# |
The number of the row. |
| tstmp | The time of the error (HH:MM), with the date under it in a smaller font. |
| attID | The attachment ID. |
| count | For a row with a count: ×N, how many errors the row holds. The column shows only when some rows have a count. |
| db | The database. The column shows only when an error names one. |
| errTxt | The error text, with the client line under it. |
- A row with a count holds one kind of error, in one minute, on one
database. Point at ×N to see the first and last time and the number of
attachments, for example
First and last error: 13:05:01-13:05:58;
 Attachments: 3
. - The client line shows the client that got the error: the application, the client address and the Firebird function. A row with a count lists the different applications and addresses of all its errors (five, then “…” if there are more). Click an application or an address to show only its errors (not in demo mode). The line is empty for older data and for clients that send no application name (many JDBC and .NET drivers).
- The table has 50 rows per page. It opens on the last page, with the newest errors.
- The total line is Total records for 18:48 — 19:48: 1397. When rows have counts, it adds the number of errors: …: 1397, errors: 4677.
Export CSV downloads all rows of the table, on all pages, with the same filters and time range.
- The file name has the day and the range, for example
errors_2026-11-03_1300-1400.csv. - The file is UTF-8 with BOM, so Excel shows all letters correctly.
- The separator is a comma in English and a semicolon in the other languages, so Excel opens the file in columns.
- A row with a count stays one line. The columns are
#,date,time,last(the time of the last error),attID,count,atts(the number of attachments),db,app,host,fnanderrTxt.last,countandattsare there only when some rows have a count;dbonly when an error names a database. Several applications or addresses are joined with;. - A text cell that starts with
=,+,-or@gets a'in front, so Excel does not run it as a formula. - The button is hidden in demo mode, because the file has the real values. It is also hidden when the table is empty.
Messages you may see
| Message | What it means |
|---|---|
| No entries for the selected date and time range. | No error matches the day, the range and the filters. Choose Full day or clear the filters. |
| No error files found | The calendar has no days: the agent has sent no trace errors. |
| Failed to load dates: … / Failed to load errors: … | The console could not read the data. The text after the colon gives the reason. |
Conflicts
Lock conflicts and deadlocks from the trace, one minute at a time. Each group is one transaction that caused conflicts.
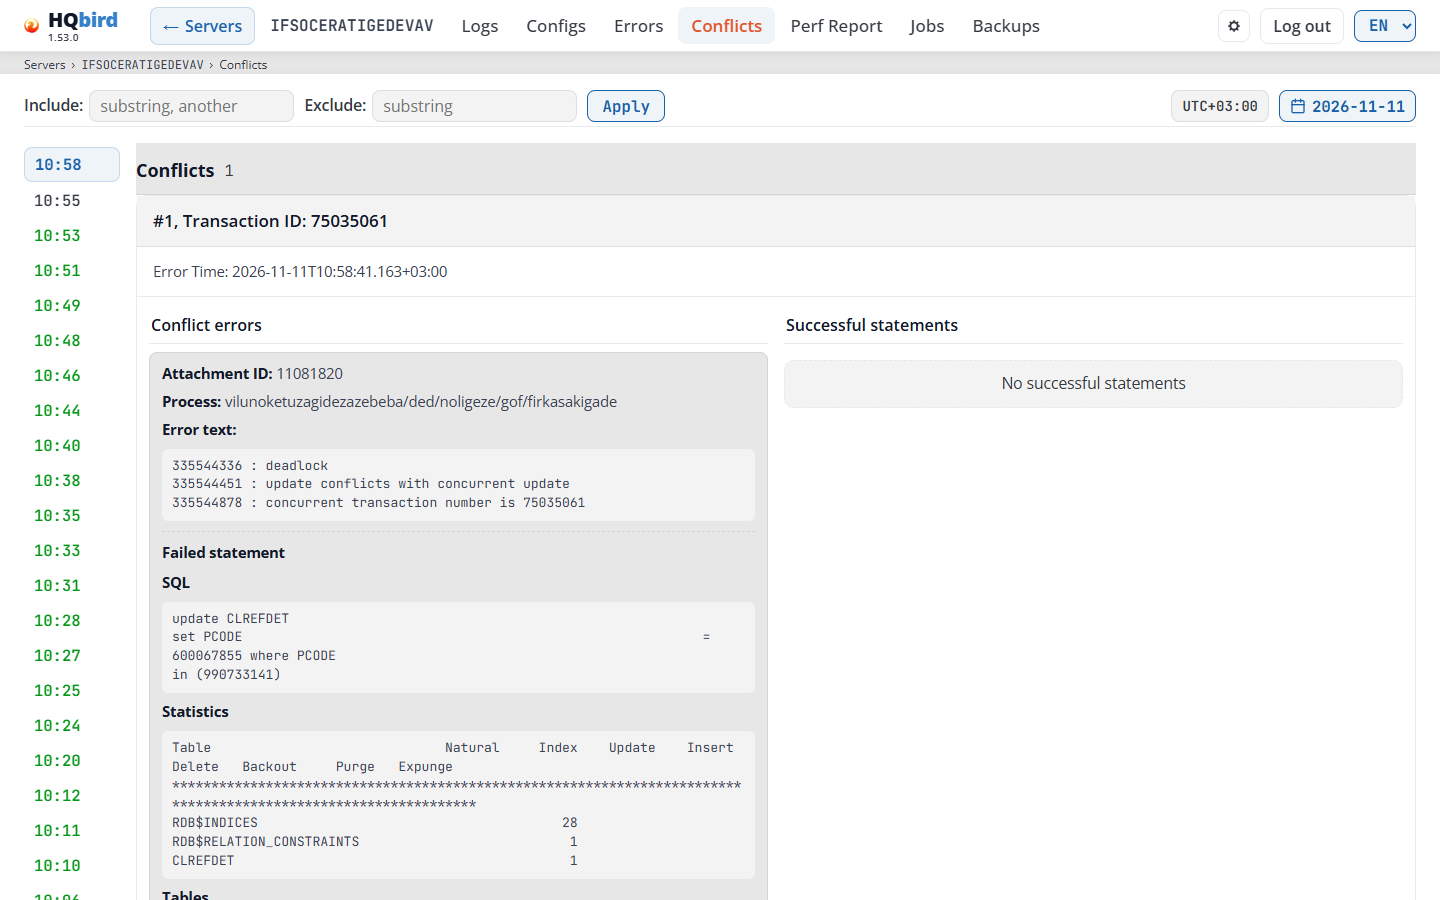
What you see
- The filter line: Include:, Exclude: and Apply (or Enter).
- The time zone badge and the date button.
- Left: the list of minutes with conflicts, newest first. A minute in green also has successful statements. The selected minute is highlighted.
- Right: the title Conflicts with the number of groups shown (after the filter), and the groups.
How to read a minute:
- Choose a minute in the list on the left. The newest one is selected.
- Each group starts with #n, Transaction ID: <id> and the Error Time.
- Compare the two columns:
- Conflict errors: the Attachment ID, the Process, the
Error text (the Firebird error codes and messages, for example
deadlockandupdate conflicts with concurrent update), and the Failed statement when the trace has it. - Successful statements: the statements of the concurrent transaction that succeeded, with their Timestamp, Attachment ID, Transaction ID and Process.
- Conflict errors: the Attachment ID, the Process, the
Error text (the Firebird error codes and messages, for example
- Each statement shows its SQL, Parameters, Statistics and Tables.
- The filters work on the text of each group, in the browser. The count in the title shows how many groups are left.
- Copy SQL and Copy SQL with parameters (when the statement has parameters) are next to the SQL. They take the SQL to your own tools. They are hidden in demo mode.
- The page address keeps the date and the minute, so you can send the link.
Messages you may see
| Message | What it means |
|---|---|
| No conflict report files found. | The agent has sent no conflict data. |
| No conflict data for the selected minute. | The minute has no groups. |
| No conflict errors / No successful statements | One column of a group is empty. |
| Failed to load conflicts: …, Failed to load dates: …, Failed to load minutes: … | The console could not read the data. The text gives the reason. |
Perf Report
The agent’s performance report for a time window: the heaviest SQL statements, processes and client addresses.
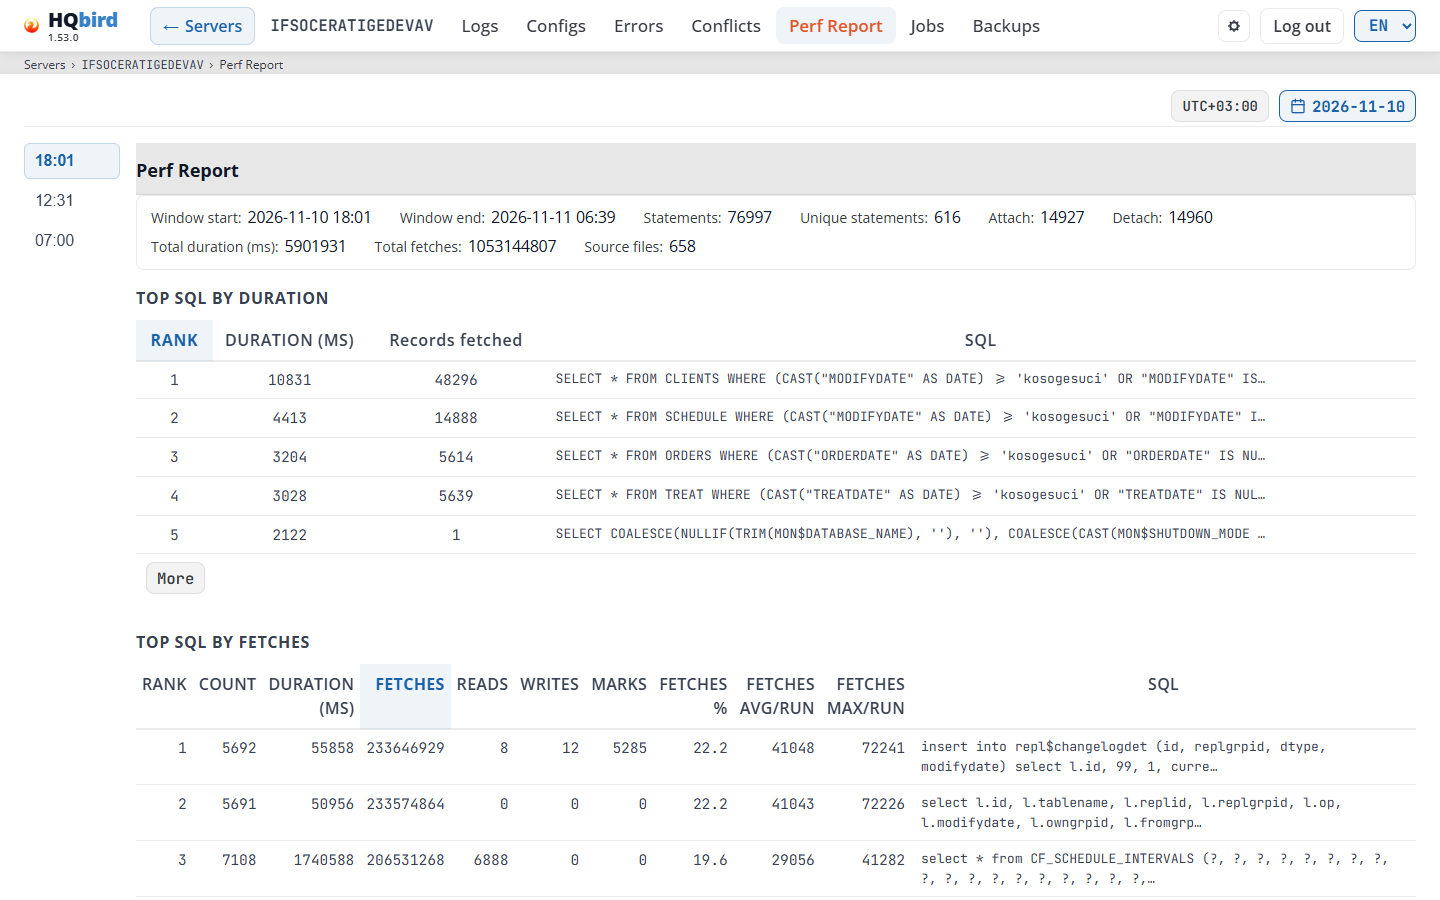
What you see
- The time zone badge and the date button.
- Left: the list of report times of the day, newest first.
- Right: the title Perf Report, the summary and the tables.
The summary: Window start, Window end, Statements, Unique statements, Attach and Detach (connections opened and closed in the window), Total duration (ms), Total fetches and Source files. A value of zero is not shown.
The tables. Each table shows 5 rows. More shows all rows, Less shows 5 again. Click a column header to sort.
-
Top SQL by duration: the slowest statements.
Column What it shows Rank The place in the list. Duration (ms) The run time of the statement. Records fetched The records (rows) that the statement fetched. SQL The statement. -
Top SQL by fetches, Top SQL by reads, Top SQL by writes: one row is one statement with its sums over the window.
Column What it shows Rank The place in the list. Count How many times the statement ran. Duration (ms), Fetches, Reads, Writes, Marks Sums over all runs. <metric> % The share of the window total for the metric of the table. <metric> avg/run, <metric> max/run The average and the largest value for one run. SQL The statement. -
Processes and Addresses: one row per client program or client address, sorted by duration.
Column What it shows Process / Address The client program or the client address. Count The statements. ATT, DET Connections opened and closed. Duration (ms), Fetches, Reads, Writes, Marks Sums for the program or address. Unique plans, Unique statements, Uniq. connections How many different plans, statements and connections.
Click a row of a Top SQL table to see its SQL (with copy buttons), PLAN, parameters and Table stats. Table stats has only the counters that the Firebird trace gives for each table: natural, index, update, insert, delete, backout, purge and expunge. Fetches, reads, writes and marks exist only for the statement as a whole. The rows of Processes and Addresses do not open.
From the health report. The Perf report button in the Queries section of the health report opens this page at the window that holds the time of the status. The rows of that query are marked with a blue background and a bar at the left. The first one is open and on screen; the table shows all rows if needed. When you choose another date or time, the mark goes away.
An old report format has one table and the summary fields Lines processed and Records created.
A window without a report. Sometimes the agent closes a window and never builds its report. It then writes a small file in place of the report. The list of times shows such a window with a short note:
| Note | Why there is no report |
|---|---|
| build aborted | The build of this window was stopped too many times. The agent does not try it again. |
| too many trace files | The window has more trace files than one run may process (max_files_per_run). |
| expired | The window was older than the processing limit (horizon_days) when its turn came. |
| no trace data | There was no trace data for the window. |
Click such a time: the page shows one sentence that says why, and no empty tables. When the page opens, it shows the latest real report, not such a window.
Messages you may see
| Message | What it means |
|---|---|
| No perf report files found. | The agent has written no performance report. |
| No data for the selected time. | The chosen report is empty. |
| The query from the server report is not in the top lists of this report. | You came from the health report, but this window does not have the query in its top lists. |
| Failed to load perf report: …, Failed to load dates: …, Failed to load times: … | The console could not read the data. The text gives the reason. |
8. Server health report
The Server health report (/report) combines the agent’s status snapshots
and its AI report for one day. Open it with:
- the Report link in the Status column of the Servers page,
- a cell of the Server strip, or
- the Server status and Report for this minute links on the dashboard.
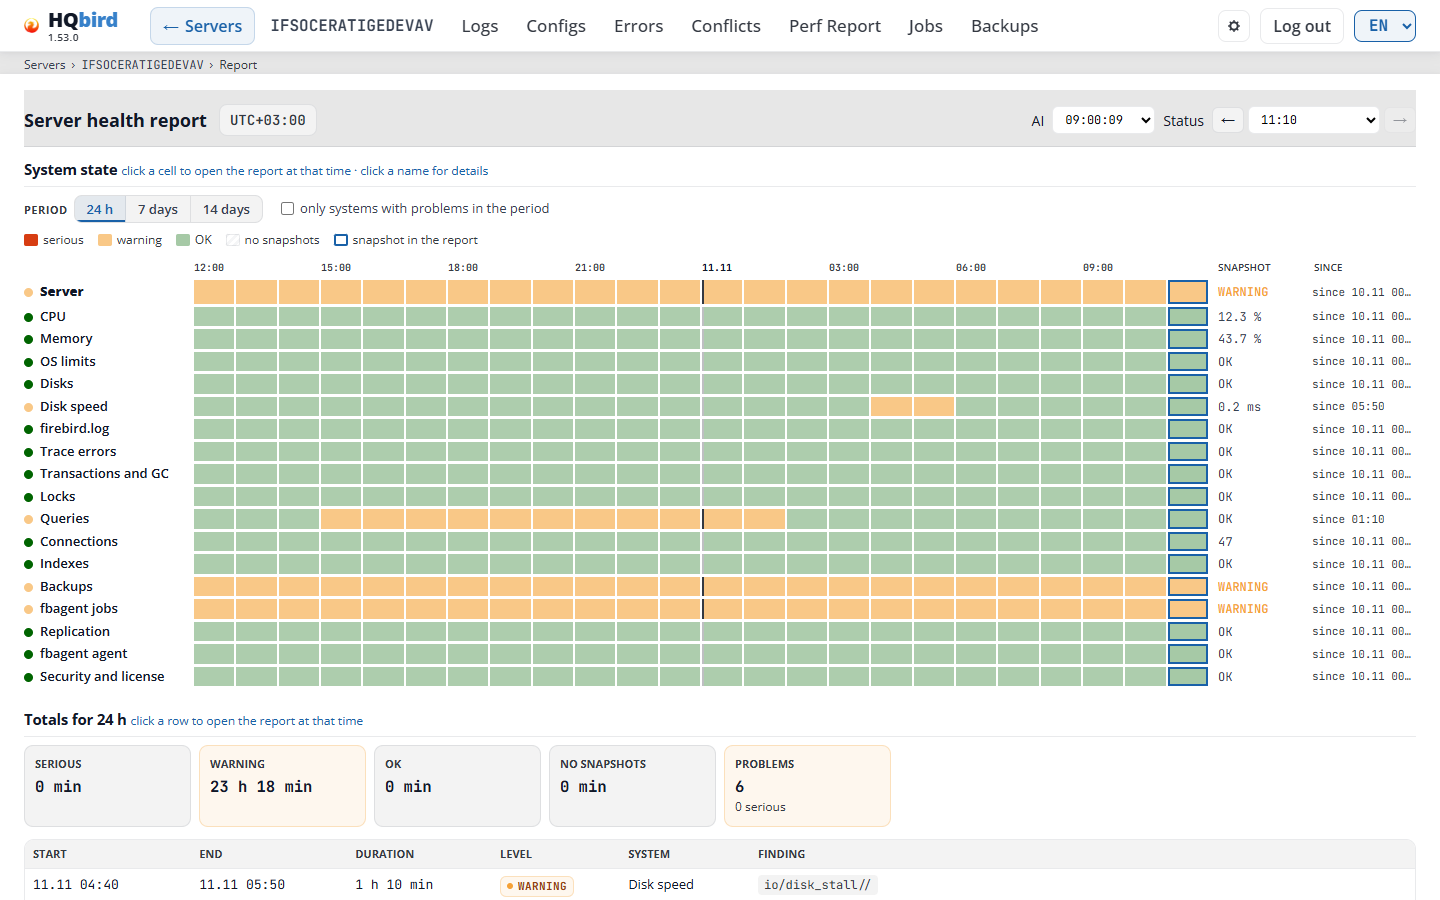
What you see
- The header: Server health report, the time zone badge, the AI list and the Status list with ← and →.
- System state: the state of each system over the period.
- Totals for 24 h (or the chosen period): time per level and the list of problems.
- Report for DD.MM HH:MM: the verdict of the shown snapshot and its changes.
- The snapshot report: the files, the key facts, the summary, the areas, the key indicators and the findings.
- The Errors, Queries and Backups sections.
- The Sources and Agent panels, and a line of extra counters.
- System details: one panel per system.
All times on the page are in the agent’s time zone. The data comes from the agent’s status snapshots (about one every 10 minutes) and its AI reports.
- A link without a date opens the day of the newest snapshot.
- A link can end with a section, for example
#area-backupsor#report-backups. The page then opens at that section and marks it for a moment. - In demo mode the page masks server and database names, and every folder and file name of a path, also inside finding keys. The separators and the file extension stay.
Messages you may see
| Message | What it means |
|---|---|
| Choose a server: the server query parameter is required. | The link has no server. Open the report from the Servers page or the dashboard. |
| No report data for the selected date. | The agent sent no status snapshot and no AI report for that day. The lists in the header are hidden. |
| No server_status snapshots in this period | The System state matrix has no data for the period. |
| invalid status snapshot / invalid ai report | The console could not read the file. Choose another time in the header lists. |
System state over a period
The top of the page shows the server over a period.
-
Period: 24 h, 7 days or 14 days. The period ends at the end of the report’s day, or now for today. It stays when you open another snapshot inside it. While older days load, the page shows Loading….
-
System state: one row for the Server and one row for each system: CPU, Memory, OS limits, Disks, Disk speed, firebird.log, Trace errors, Transactions and GC, Locks, Queries, Connections, Indexes, Backups, fbagent jobs, Replication, fbagent agent, Security and license. Other findings is a row only when it had a problem. The dot before a name shows the worst level of that row.
- A cell is 1 hour (24 h), 4 hours (7 days) or 6 hours (14 days). It shows the worst level in that time. The legend explains the colors: red is serious, orange is warning, green is OK, hatched is no snapshots. The cell with the blue frame is the snapshot in the report. Point at a cell to see its time, system and level.
- Click a cell to open the report at that time. Click a system name to open its panel in System details.
- Snapshot shows the level in the shown snapshot. For CPU, Memory, Disk
speed and Connections it shows the value (for example
8.9 %,0.2 ms,1160). - Since shows since when the system has this level:
since 10:40, orsince 03.11 00:00when it started on another day. - only systems with problems in the period hides the rows that were OK all the time and lists their names after OK for the whole period:.
-
Totals for 24 h: tiles Serious, Warning, OK and No snapshots show how long the server had each level. Problems shows how many problems it had, with the serious ones under it. A tile with a value above zero is colored. The table below lists each problem:
Column What it shows Start When the problem started. ≤means that it started before the period.End When it ended. still active means that it is still open now; active at the end means that it was open when a past period ended. Duration How long it lasted. Level The level badge. System The system of the problem. Finding The finding key. Click a row, or press Enter on it, to open the report at that time. The table shows up to 300 rows, then … more not shown. Without problems it says No problems in this period.
-
Report for DD.MM HH:MM: the level and the main line of the shown snapshot. For an older snapshot a banner says Snapshot from history: <time>, and To the latest snapshot of the period opens the newest one. Two lines of chips show the changes:
- Since the previous snapshot: the change from the snapshot before.
- Over the period: the change from the first snapshot of the period.
+ keyis a new finding,↑ keyis a finding that got worse (warning to serious),− keyis a finding that cleared. no changes means nothing changed.
The snapshot report
Under the period sections, the report of one snapshot shows:
- AI and Status lists (in the header): choose an older AI report or status snapshot of the same day. Latest AI and Latest status are the newest. The ← and → buttons beside the Status list open the previous and the next status snapshot, also across midnight (point at a button to see the time). The browser’s Back button returns through the snapshots you opened.
- Selected files: the names of the two files, or No status snapshot for date / No AI report for date. A warning such as Status and AI timestamps differ by 250 min means that the two files were made more than 15 minutes apart.
- The level (for example WARNING), the HQbird badge, and a line of
key facts. The level is the server level from the agent’s verdict; a
snapshot without a verdict shows its old severity. A small Agent:
LEVEL badge follows only when the level of the agent itself is worse. The
key facts are: agent and Firebird version, the Firebird Mode (SuperServer,
SuperClassic or Classic; fbagent 2.94.0 or newer), number of databases,
attachments (with the change, for example
(Δ+12)), the main and the secondary bottleneck, and the time of the status and of the AI report. Whenfirebird.confsets another mode, a note after the mode says so, for example “firebird.conf sets Classic: it takes effect after a Firebird restart”. - The summary text of the AI report.
- Areas: chips such as
engine_errors,io,queries,backups,clients,agent,cpu. A colored chip has findings and shows how many. Click it to go to the findings of that area. A grey chip has no findings and is not a link. - Key indicators: tiles from the status snapshot. A tile is a link only
when its section is on the page.
Tile What it shows Click goes to ERRORS The trace errors of the day, with the LWM errors under it ( today · LWM 1.92M). Its color follows the open findings on trace and LWM errors: red is serious, amber is warning, no color means no finding or an acknowledged one.Errors section LONG_TX The number of long transactions. Only when there are some. Not a link LWM_LAST The time of the newest LWM data. Amber with stale …swhen thelwmmonsource is late.Sources panel AGENT_LOGS The agent’s log folder in percent of its limit, and the size ( 3.00 / 3 GB). Red at 100% or more.Agent panel RESOURCE_GUARD The state of the agent’s resource guard, for example cooldown.Agent panel CPU_HOST CPU % and, under it, load and ram %. Withavg 10mthe numbers are the 10-minute averages, the same as in the System state matrix. An older snapshot shows the values of that moment, with the used and total RAM. Faded with—andcpuram missingwhen the agent sent no host data.The cpu findings; a link only when the snapshot has a CPU finding
Below are the findings, in groups by area in the order of the chips. Each group shows its count. In each group the most serious finding comes first. Findings of the AI report that have no area are in the last group, other. The queries and backups groups have a link to their table: → query table and → backup table.
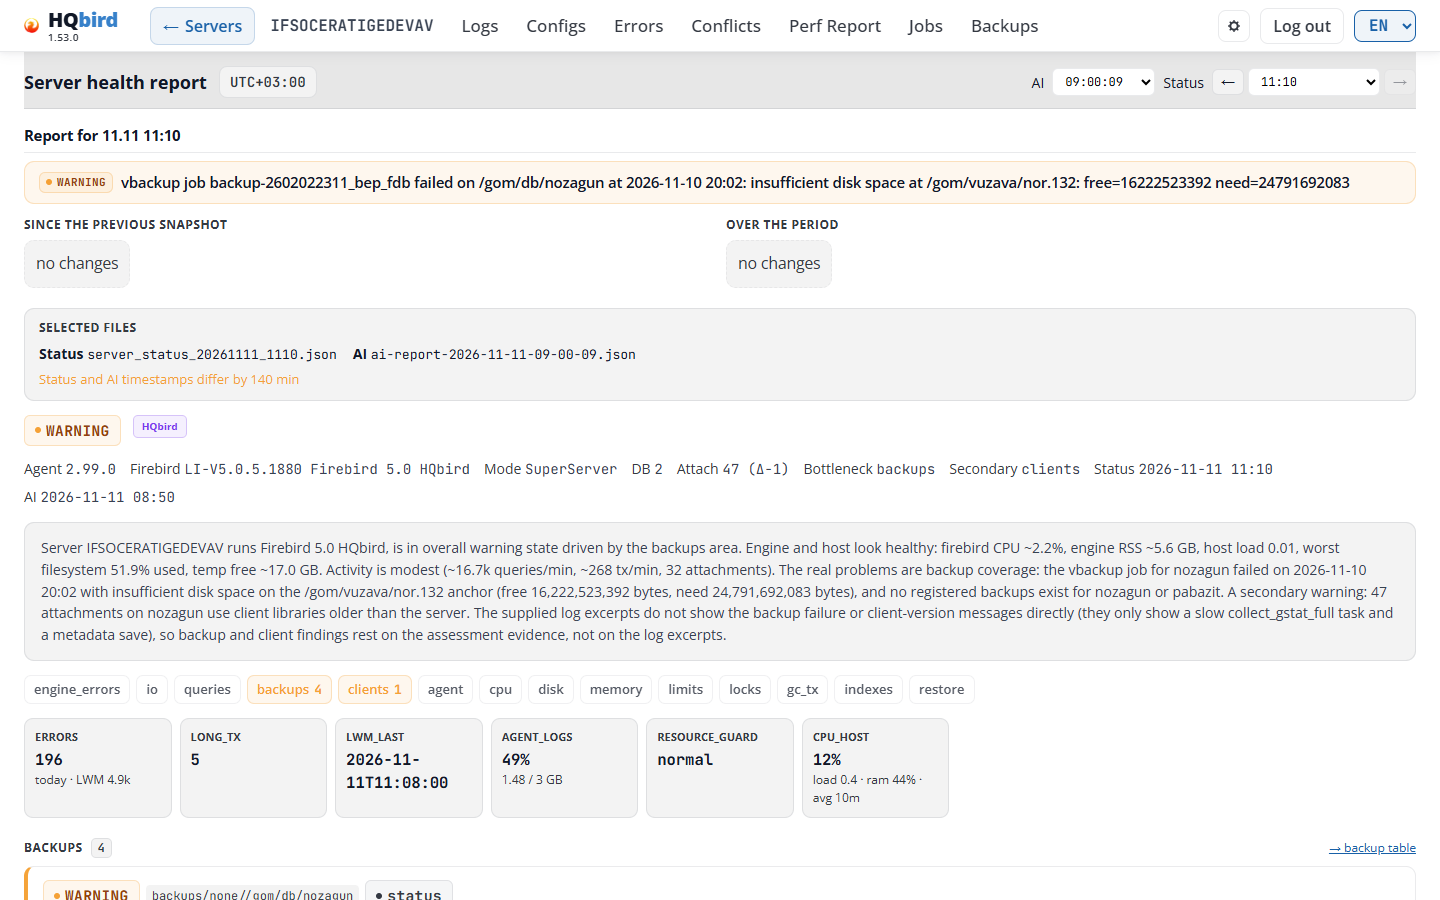
A finding card has these parts:
- The head: the severity badge (SERIOUS, WARNING, …), NEW for a finding
that is new since the previous snapshot, the finding key (for example
backups/none//data/employee.fdb), and the source:status(the status snapshot),ai(the AI report) orstatus + ai(both name it). - The title: what the agent found.
- From the AI report: Explanation, Impact and Next checks. Evidence shows when it differs from the title.
- From the status snapshot: a short Hint, for example “configure nbackup/vbackup or scan paths”.
- The filesystem_warnings and filesystem_errors findings have a Found block: the paths that the agent’s filesystem check found (up to 5, with the reason) and Checked at <time>.
- Action buttons, when the agent’s configuration can fix the finding. The first button is the main one.
- A finding with a value shows it against its limit on one line, for example
476.5 MiB / 1 GiBor25.2 h / 1 h. Each number has its own unit.
Every active finding has a card. A newer agent lists all its findings, but gives a text only for the 15 worst ones. A finding without a text is a short card with its key only. The Backups table also has a row for each backup finding, past the 15 too.
Repeated findings share one card. Three or more findings with the same key start and the same level, for example 13 replication sources that the agent cannot read, are one card. The card lists the objects: the name, the text, since when, and NEW. The first 10 are open; Show N more shows the rest. A fix button for one database stays next to that database. A button that all objects share shows once on the card. Only snapshots with a verdict (schema 26 or newer) join findings like this. The area chips and the group counts still count each finding.
Action buttons. A button opens the Agent configuration editor at that place: it adds the job for the database, opens the job or its row, or shows the setting. Examples: Add an nbackup job, Add a gbak backup job, Set the .nbk scan folders, Set the .fbk scan folders, Open the backup scan settings, Open the Backups page, Add an index statistics job, Edit the ignored firebird.log errors, Open the job.
- The editor saves nothing until you click Save. If a job for that database is already there, the editor opens it and does not add a second one.
- You see the buttons only if you may open the editor for this server, and only if the server has an agent configuration.
- A row in the Backups table has the main button only.
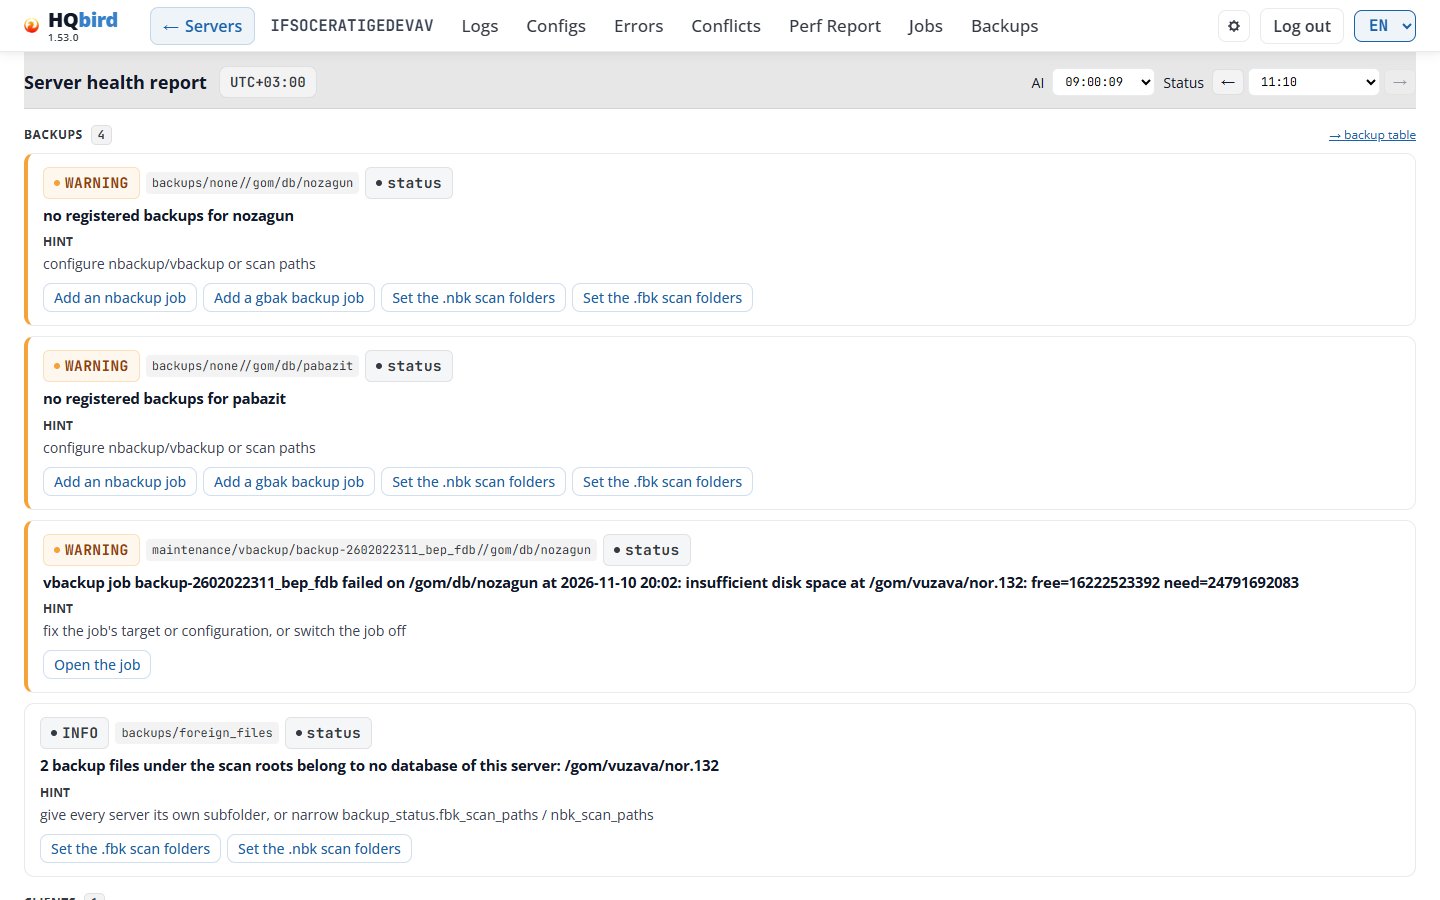
Errors, Queries and Backups sections
After the findings come the Errors, Queries and Backups sections. A section shows only when it has data.
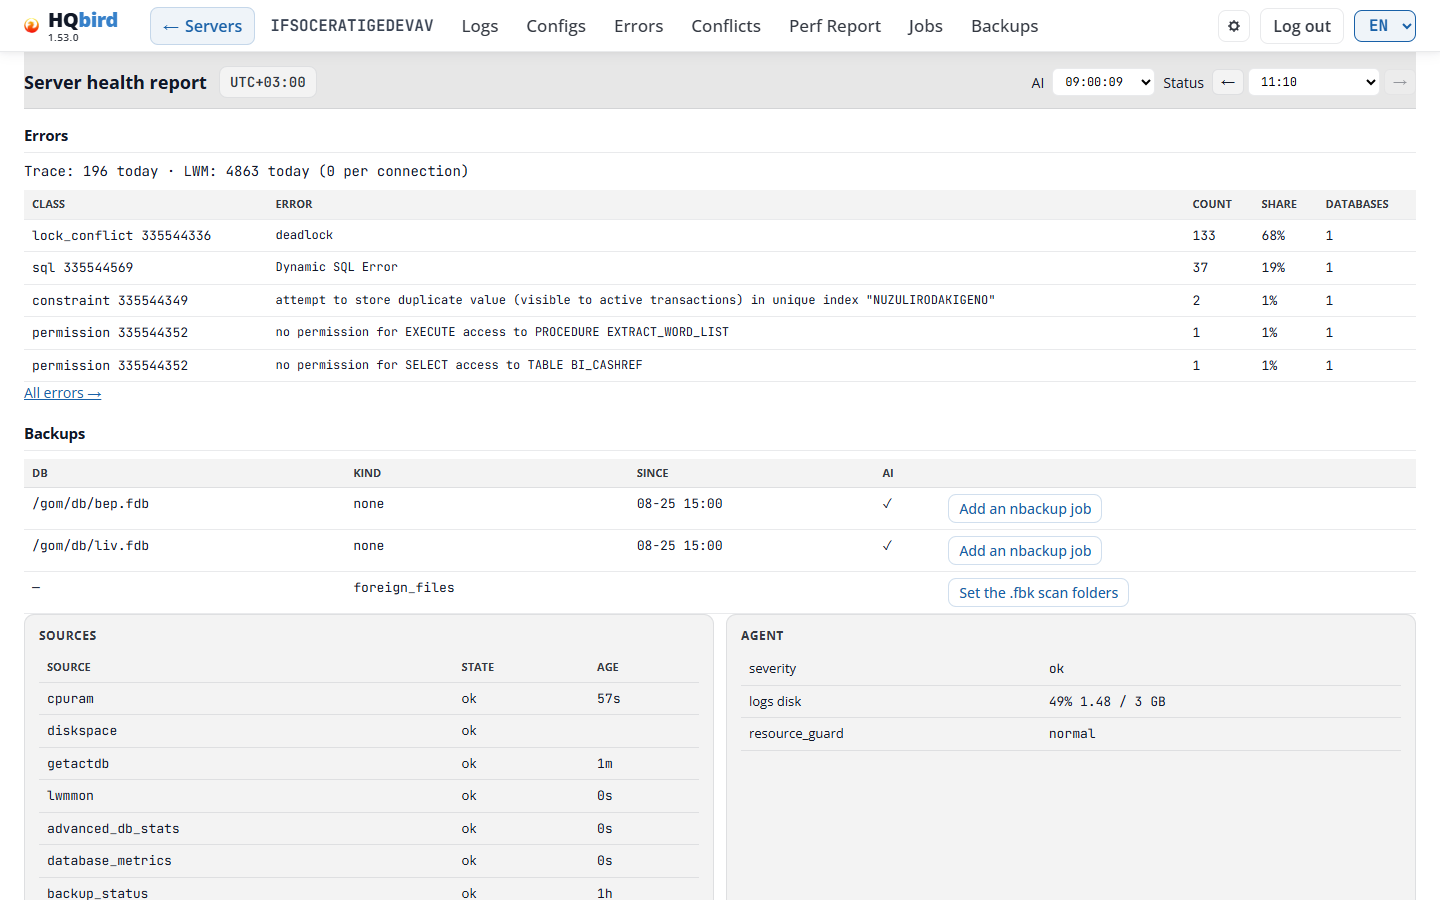
Errors: the trace errors of the day. The first line is
Trace: 90601 today · LWM: 1924677 today (0.01 per connection). The part in
brackets needs an agent that sends it. The table has the five most frequent
kinds of trace error:
| Column | What it shows |
|---|---|
| Class | The class of the error and its Firebird code, for example io_open 335544344. |
| Error | The error text. |
| Count | How many such errors the day has. |
| Share | The share of all trace errors of the day. |
| Databases | In how many databases the error happened. |
All errors → opens the Errors page for that day. The kinds need an agent that sends them.
Queries: the top queries from the status snapshot and the AI report.
| Column | What it shows |
|---|---|
# |
The rank. |
| Source | status or ai. |
| DB | The database. |
| Avg s | The average run time in seconds. |
| Runs | How many times the query ran. |
| SQL | The query text. Click Plan to see the execution plan. Perf report opens the Perf Report window that holds the time of the status and marks the query there. Before the agent writes that window, the cell says No Perf report for this time yet. When the agent closed the window without a report, the cell says No Perf report for this time: and the reason. Queries from an older agent have no button. |
Backups: one row per backup finding.
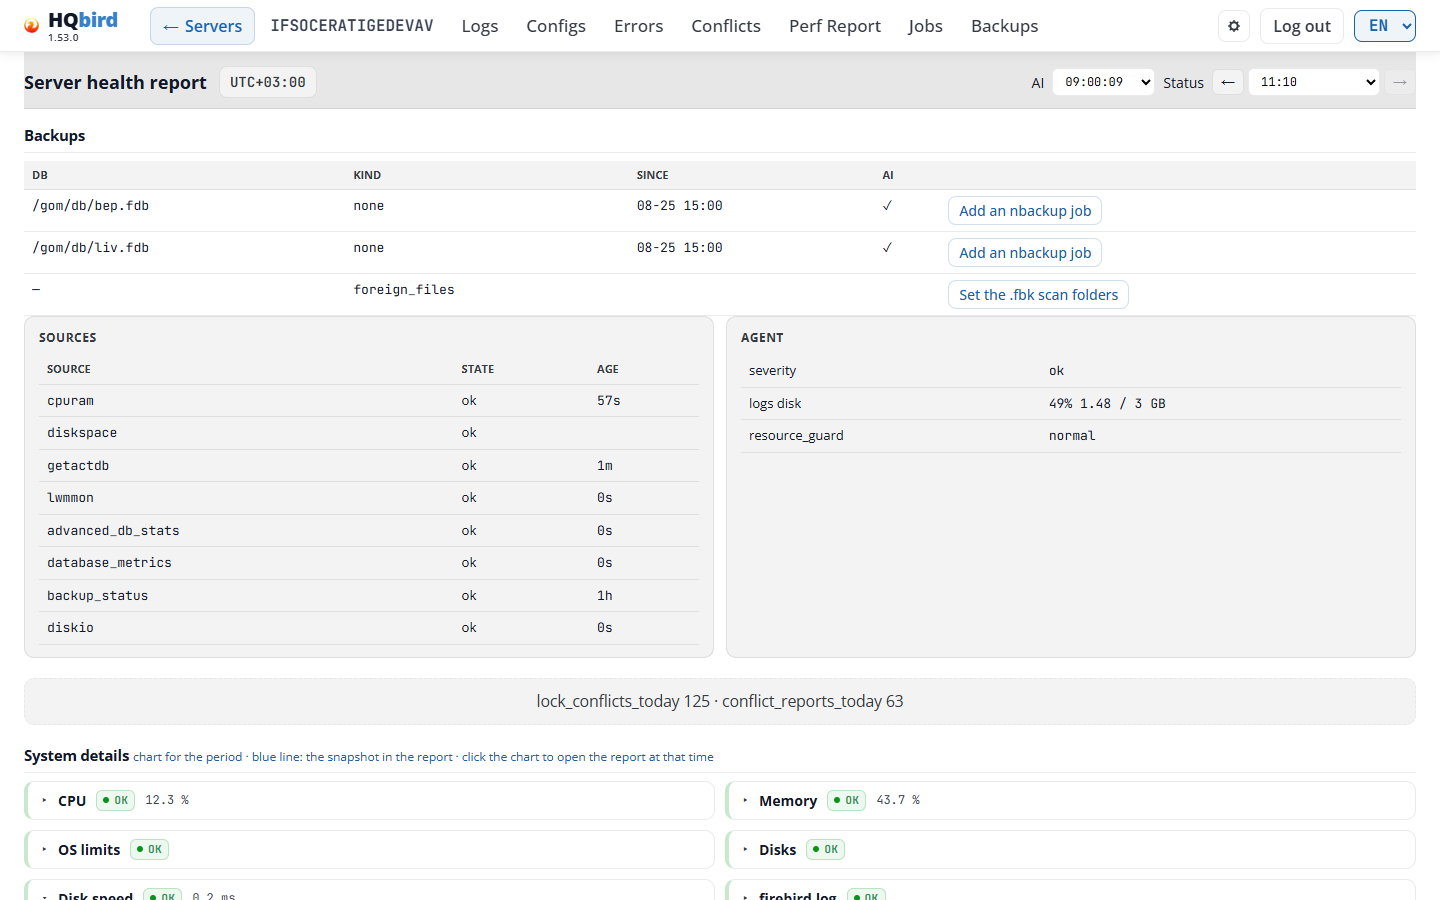
| Column | What it shows |
|---|---|
| DB | The full path of the database, on Linux too, for example /data/employee.fdb. A finding for the whole server shows —. A row that only the AI report names shows the name the AI used. |
| Kind | The kind of the finding: none (no backup), nbackup_locked (the database is in an nbackup lock), stale, nbk_missing and so on. |
| Since | When the finding started: 19:30, or 11-02 19:30 when it started on an earlier day. |
| AI | ✓ when the AI report also names this database. |
| (last column) | NEW for a new finding, a note such as OIT gap (AI), and the main action button. |
Sources and Agent are two panels side by side.
| Sources column | What it shows |
|---|---|
| Source | The data source of the agent, for example cpuram, lwmmon, diskio. |
| State | ok, stale (late) or missing. A stale or missing row is marked. |
| Age | The time since the newest data of the source, for example 57s, 4m, 1h or 24h. |
The Agent panel shows the agent’s own state: severity, failing (the
failing tasks), logs disk (percent of the limit and size), self_repair
(repairs in the last 24 hours and the last one) and resource_guard (the
state and the time of the last trip). A row shows only when it has a value.
Under the panels, a line shows counters that only the status snapshot has, for
example lock_conflicts_today 48 · conflict_reports_today 38.
System details
System details, at the end of the page, has one panel per system (not for the Server row). Other findings has a panel only when it had a problem. The line of each panel shows the name, the level badge and the current value. A panel is open when the system had a problem in the period or has one now.
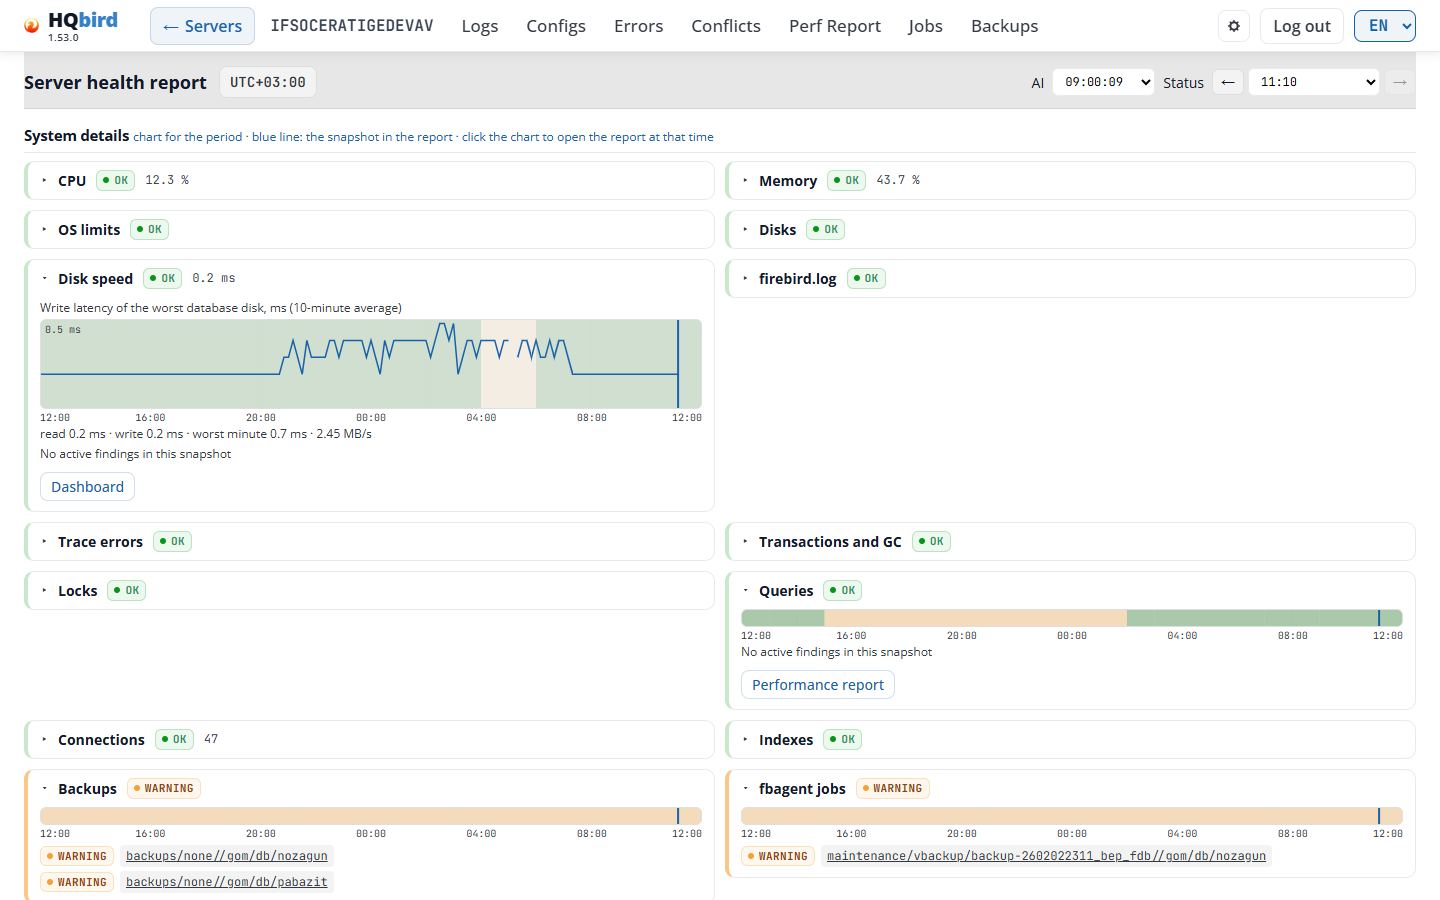
- CPU, Memory and Disk speed have a chart of the 10-minute average,
with dashed threshold lines: Thresholds: warning X, serious Y (10-minute
average). Disk speed is the write latency of the worst database disk. Its
numbers line is
read … ms · write … ms · worst minute … ms · … MB/s. - Connections has a chart of attachments.
- The other systems have a colored band of their level.
- The blue line marks the shown snapshot. Click a chart to open the report at that time.
- Under the chart are the findings of the shown snapshot, with links to their group in the report, or No active findings in this snapshot.
- A button opens the page that helps further: Dashboard (CPU, Memory, Disk speed, Connections), firebird.log (the Logs page), Errors (Trace errors) or Performance report (Queries).
Tables in the panels. Four panels also show the numbers that the agent measured in the shown snapshot. A table shows its first 10 rows and Show N more. A value that the agent left out is an empty cell or no row. A snapshot without these numbers shows the panel without tables.
-
Disks: Volumes (volume, what it is used for, used %, free, total) and Temp folders (folder, source, volume, free, total, level). The volume that the agent’s free-space finding measured has its level and comes first.
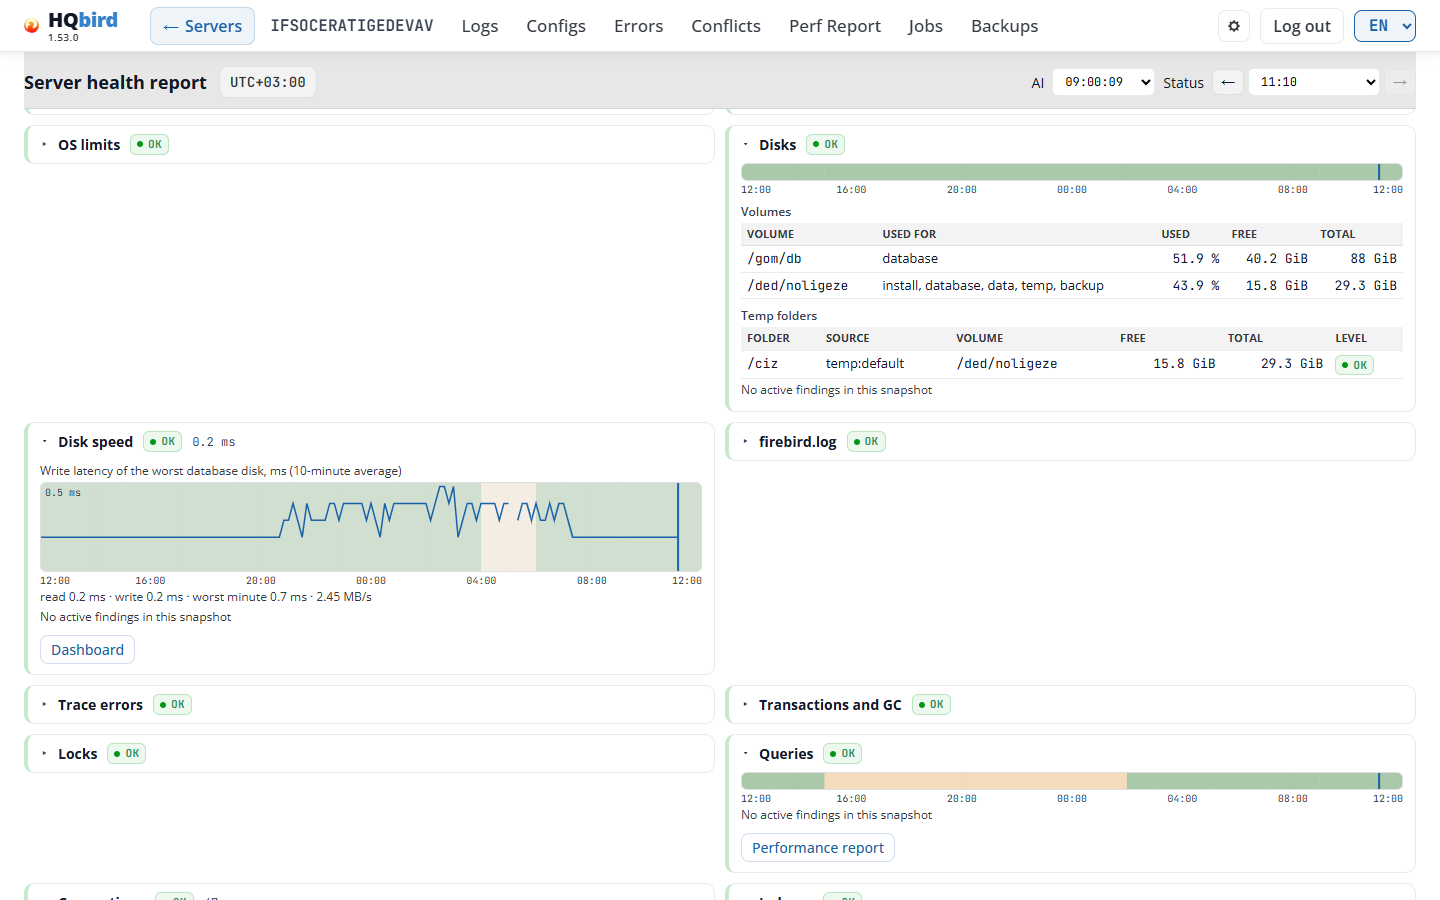
The Disks panel with its Volumes and Temp folders tables
-
Transactions and GC: Databases (OIT gap, OAT gap, OAT gap in time, transactions per minute, long transactions), the database with the most long transactions first; and Long transactions (age, database, user, process, address), the oldest first. When the snapshot counts more databases than it lists, a note says so.
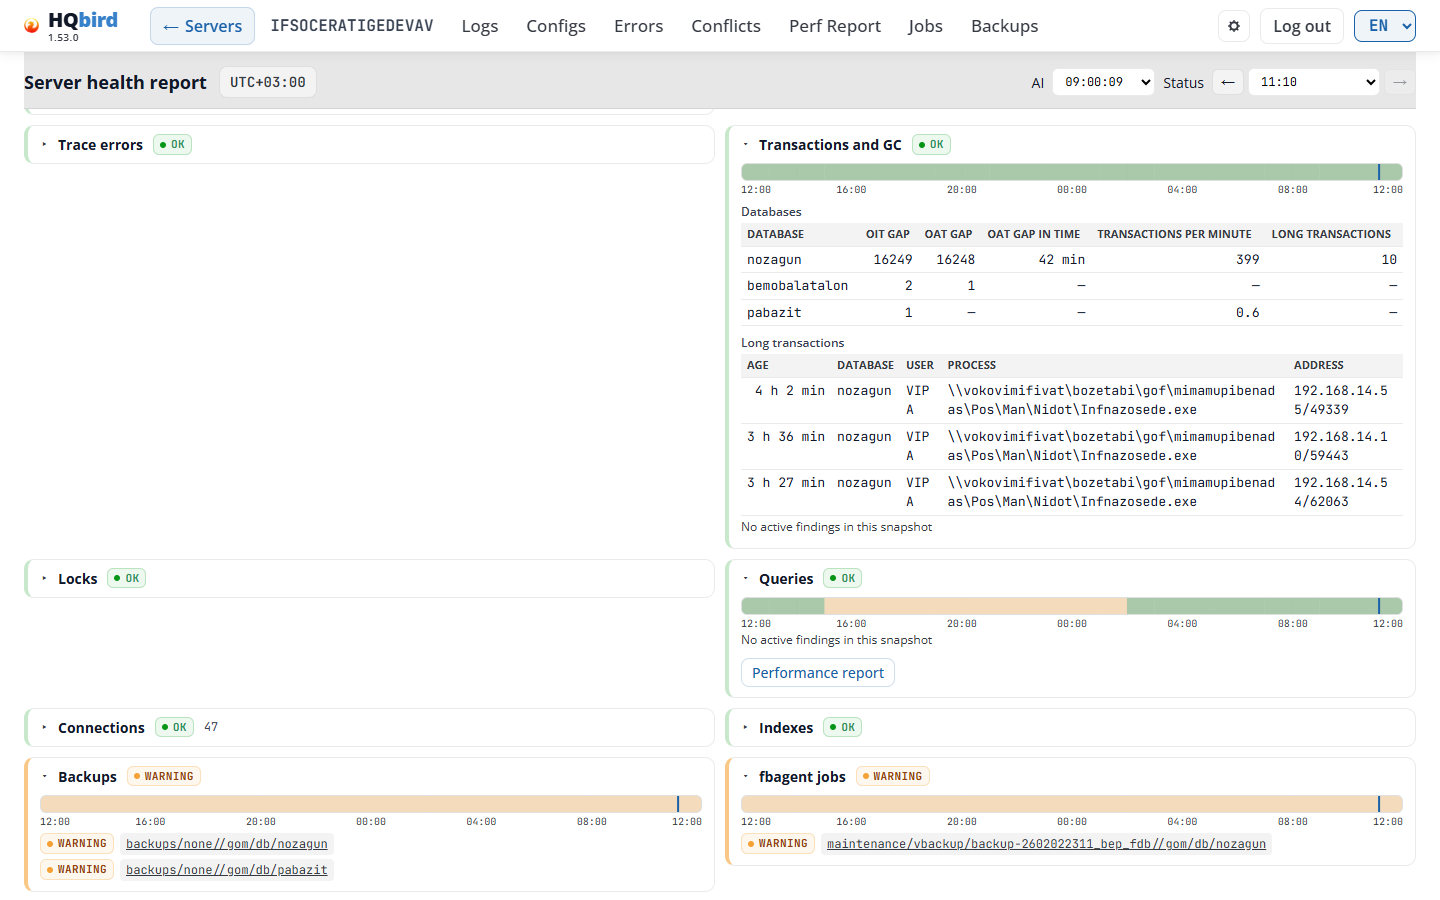
The Transactions and GC panel with its databases and long transactions
-
Replication: Masters (database, segments in the archive, archive size, oldest segment) and Replicas (database, segments waiting, waiting size, lag, last applied, error). Rows with an error come first, then the longest lag or the largest archive. A column shows only when a row has a value for it.
-
fbagent agent: the agent’s own health. Agent state (uptime, restarts in 24 h, files waiting for upload and the oldest one, failed uploads in a row, last successful upload, log errors in 1 h and 24 h, last self-update, resource guard, agent CPU and memory) shows all its rows. File queues (lock conflicts, trace, performance report: files, size, oldest file) and Top tasks, last 15 min (CPU time, runs, memory growth, score).
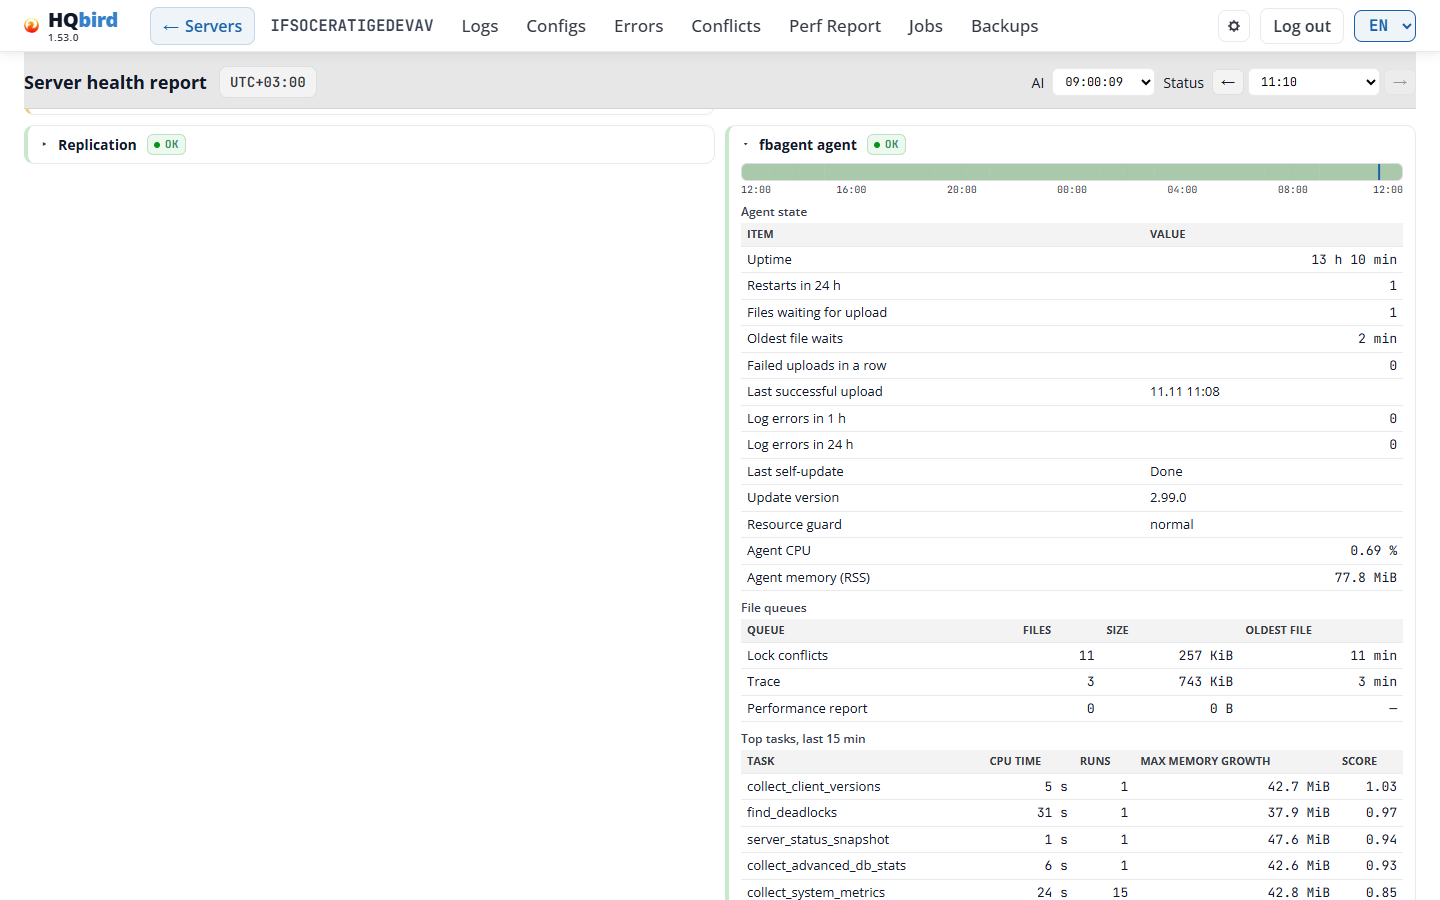
The fbagent agent panel: agent state, file queues and top tasks
In demo mode the database names, users, processes, addresses, paths and error texts in these tables are masked.
The display density on the Settings page makes the report text smaller or larger.
9. Agent configuration editor
The agent configuration editor has three pages:
- Jobs opens the editor. It has the tabs Jobs, Settings, Problems and Activity.
- Backups opens the backup inventory of the server.
- Activity shows how the agent’s scheduler tasks ran.
The Jobs and Backups links appear in the top menu only when the console has the agent’s configuration. The top menu marks Jobs on the Jobs and Activity pages, and Backups on the Backups page.
The fbagent user guide describes every job and setting in detail. This chapter explains the pages.
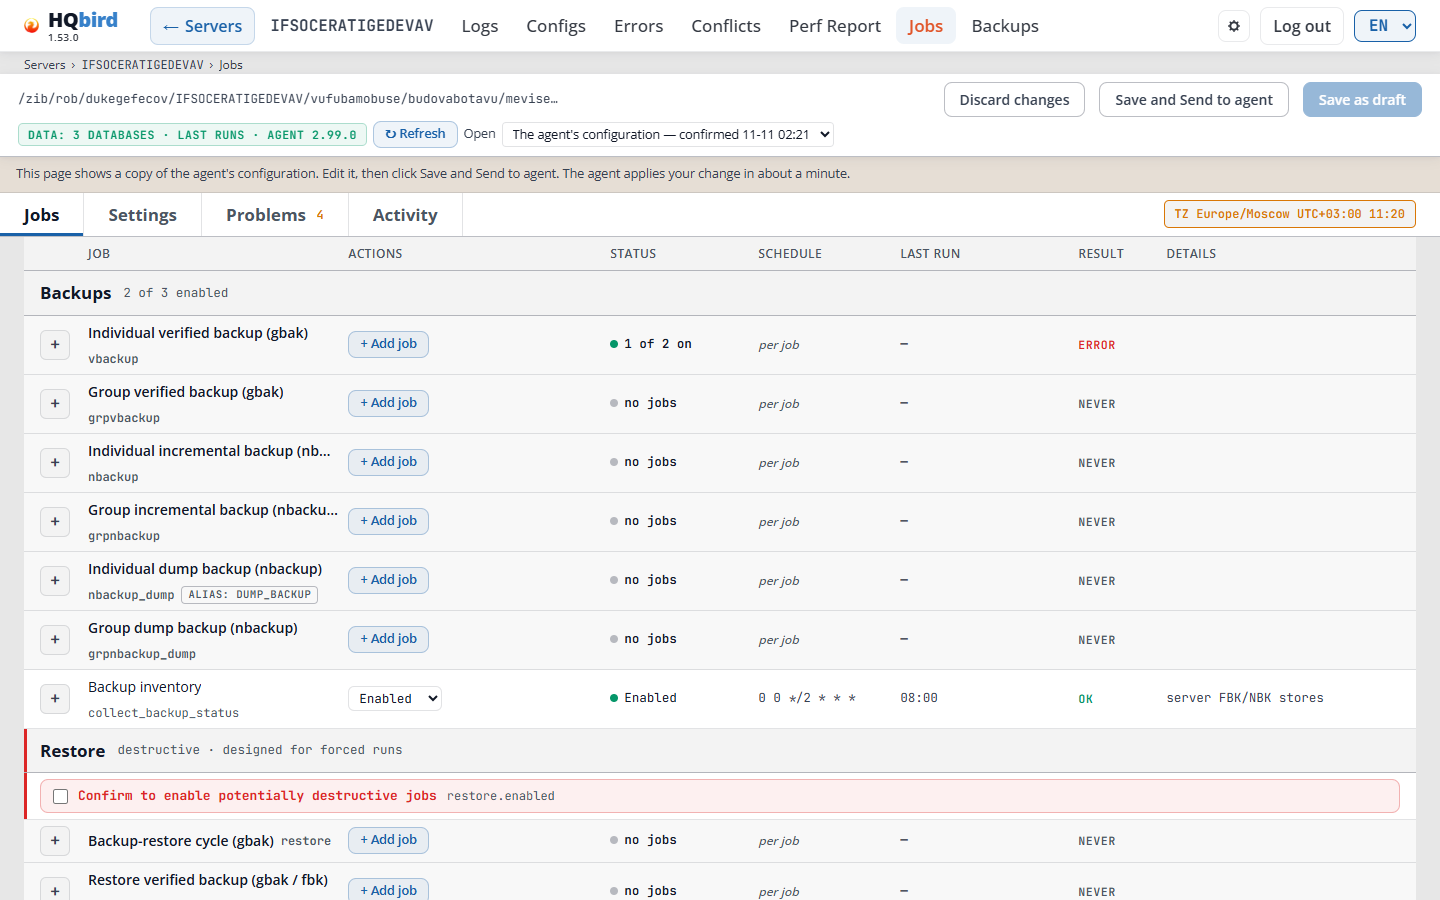
What you see
- The console header: ← Servers, the server name, the top menu and the
breadcrumb line, for example
Servers › SRV › Jobs. - The editor header: the file that the editor opened, the data badge, ↻ Refresh, and the save buttons at the right.
- A note line under the header. In remote mode it says that the page shows a copy of the agent’s configuration.
- The tabs Jobs, Settings, Problems (with the number of problems) and Activity. The TZ badge is at the right end of the tab line.
- The jobs table, in groups: Backups, Restore, Maintenance, Performance monitoring, SQL update, Health-check and System jobs.
- At the bottom: the Scheduler tick tasks table.
The editor header
- ← Servers goes back to the Servers page. The breadcrumb line shows where
you are:
Servers › SRV › Jobs,Servers › SRV › Jobs › ActivityorServers › SRV › Backups. Click a part of it to go there. - The file that the editor opened. In remote mode this is the newest configuration snapshot that the agent sent.
- The data badge, for example DATA: 3 DATABASES · LAST RUNS · AGENT 2.99.0. It shows what the editor knows from the agent’s data: the database list, the last runs of the jobs and the agent version. Point at it to see the data folder, the time of the database list, how many databases were attached in the last record, and when the editor read the data.
- ↻ Refresh reads the agent’s data again: the job results, the last runs and the recorded commands.
- Discard changes drops your unsaved changes. An unsaved changes mark with a count appears after you edit something. Point at it to see the changed sections.
- The save buttons. They depend on the mode (see Saving: local mode and Saving: remote mode). Save works at once, also while the cursor is still in a field you are typing in.
- Open appears in remote mode when there are drafts. It lists the agent’s configuration and your drafts.
- The TZ badge: the agent’s time zone (
agent.timezone), its UTC offset and the current time there. Schedules use this zone. Point at the badge to see the difference to your browser’s time. Click it to set the zone. When the zone is empty, the badge shows TZ not set: then the schedules follow the zone of the agent host.
Messages you may see
| Message | What it means |
|---|---|
| RUNTIME: OFFLINE (instead of the data badge) | The editor found no agent data. The Last run and Result columns stay empty. |
| Refresh failed — the editor could not read the agent runtime files | ↻ Refresh did not work. Try again later. |
| This page shows a copy of the agent’s configuration. Edit it, then click Save and Send to agent. The agent applies your change in about a minute. | Remote mode with delivery. The page also shows this line on the Backups and Activity pages. |
| Reading a copy of the agent’s configuration. This console cannot deliver an edit to the agent; download the JSON and apply it on the agent host. | Remote mode without delivery. You can read the configuration, but not send a change. |
| … the file the agent writes this from did not arrive with the logs. | One part of the agent’s data is missing on the console. The line names the part, for example The Last run column or The database picker. |
| … no agent data tree was found beside this configuration. | The console has the configuration, but no agent data. |
| … the newest records are older than this agent should be producing, so what is shown is not current. | The agent data is old. On a console, the next log pack usually brings new data. |
| … the file is in a newer format than this editor reads. | The agent is newer than the editor. Update HQ Monitor. |
| The Result column is empty because the agent did not send the job-start information. | The agent did not send the job results. |
Jobs tab
The jobs are in groups. The group header says how many jobs are on, for example 1 of 2 enabled. The Restore group is marked destructive · designed for forced runs: these jobs are meant for Run now, not for a schedule.
Each line is one job type:
| Column | What it shows |
|---|---|
| (+) | Opens the line: the jobs of this type, their options and the last run. |
| Job | The name and the scheduler task, for example process_traces. Small badges give more facts, for example PER-DB (one run per database) or ALIAS: DUMP_BACKUP (the old task name dump_backup runs the same jobs). |
| Actions | + Add job for job types that hold a list of jobs (for example one backup job per database). An Enabled / Disabled list for the other lines. Clear & enable when the resource guard stopped the task. |
| Status | Whether the job runs (see the table below). A short reason can be under the status word. |
| Schedule | The cron of the task. per job means that each job of the list has its own schedule. on tick means that the jobs run at each tick of the task. continuous is a task that runs all the time. The Performance test line also shows its execution window with the weekdays. |
| Last run | When the task or the job last ran, in agent time, in 24-hour form. |
| Result | OK, ERROR, NEVER (never ran) and others (see below). |
| Details | What the job works on, for example server FBK/NBK stores or host. |
+ Add job adds a job and scrolls to its form. The first job of an ordinary job type also turns its section on and creates its scheduler task. When you delete the last job, the editor removes the task. A destructive job type (Restore, SQL update) never turns itself on: a new job of this type is created disabled.
Status. A job runs only when two switches are on: the flag of its section and its scheduler task. The Status column shows both. When the two switches tell different things, the reason is written in small text under the status word.
| Status | Meaning |
|---|---|
| Enabled | Both switches are on. |
| n of m on | A job list: n of its m jobs are on. |
| 0 of m on, with all jobs off under it | The section and the task are on, but every job of the list is off. The HQbird import leaves a job type like this on purpose: it imports the jobs disabled, for you to check. |
| Disabled | Both switches are off. no tick row under it: the scheduler has no task for this job type. |
| gates differ | One switch is on and the other is off. The job does not run. The reason under it says which one is off: section off, section off (default), tick off or no tick row. |
| no jobs | The job list is empty. + Add job creates the first one. |
| not present | The scheduler has no task for this job, and the job is off by default. |
| row missing | The job is on by default, but the scheduler has no task for it. |
| Suspended | The agent’s resource guard stopped the task for now. The guard is named under it, for example by resource_guard. |
Result. A job list shows the worst result of its enabled jobs.
| Result | Meaning |
|---|---|
| OK | The last run worked. |
| WARN | The last run finished with a warning. |
| ERROR | The last run failed. Point at it to see the error. |
| RUNNING | The job runs now. |
| DEFERRED | The job waited for another job, for example for a database lock. This is not an error. |
| STALE | The status file in the job’s folder belongs to another job or another database, so it is not this job’s result. Give the job its own folder. |
| NEVER | The job never ran. |
| NOT HERE | The job’s status files stay on the agent’s host and did not come to this console. The job can still run normally. |
| TICK OK / TICK ERR | The page has no result for each job, so it shows the result of the last scheduler tick. |
overdue (every Nm) under the Last run time means that the task has not run for more than three times its usual interval of N minutes.
The Restore group. Under the Restore header is one line: a check box
Confirm to enable potentially destructive jobs with the key
restore.enabled. It is the section flag of all three restore job types, so
the editor asks only once. Each restore job keeps its own Enabled switch.
The SQL update group asks the same question in its open line.
An open line shows its jobs, one line per job:
- the check box that turns the job on or off;
- the job id, Edit (or Close), Delete and Run now;
- N required empty when required fields are empty. Click Edit: the empty fields have a red frame. When you save, the editor turns such a job off;
- the schedule of the job, with DEFAULT when the job has no schedule of its own, and the next run, for example next run 11-07 02:00, sampled by the restore tick;
- the last run and the result;
- Details: the last outcome of the job (see Job logs).
A line without a job list (for example Host CPU / RAM or Disk IO) has a button <section>.* section fields. It opens the fields of that section, for example the agent switches.
The Health-check group has a Disk IO line (collect_disk_io): the
agent measures the read and write latency and the throughput of the disks with
databases and temp files once a minute. It is on by default (fbagent 2.87.0 or
newer). Its data makes the disk IO charts on the dashboard.
Schedule uses six fields, with seconds first:
second minute hour day month weekday. For example 0 */2 * * * * is every
2 minutes, and 0 0 */2 * * * is every 2 hours. The job form shows the six
fields one by one (SEC, MIN, HOUR, DOM, MON, DOW), and
says in which time zone the agent reads them.
Scheduler tick tasks. The table at the bottom of the tab lists the rows of
scheduler.tasks. The editor creates and removes these rows with their jobs.
| Column | What it shows |
|---|---|
| Task | The task name. Badges: retired, unknown, alias, guard, no jobs. |
| Runs for | The job type that the task runs. |
| Schedule | The tick cron of the task. |
| Timeout, s | The time limit of one run, in seconds. 0 means no limit. |
| On | Whether the task is on. |
| Last run | When the task last ran. |
Messages you may see
| Message | What it means |
|---|---|
| No jobs yet — Add job creates the first one. | The open line has no jobs. |
| No recorded run for this job yet. | The agent has no run of this job. |
| No scheduler.tasks rows in this config — adding a job creates the one it needs. | The scheduler table is empty. |
| Warning: an enabled … job re-runs on every tick — prefer forced runs | You turned on a job of a destructive type. Prefer Run now. |
Job forms
Every job form (vbackup, nbackup, nbackup dump, sweep, index statistics, backup-restore cycle) shows its fields in titled groups, in two columns.
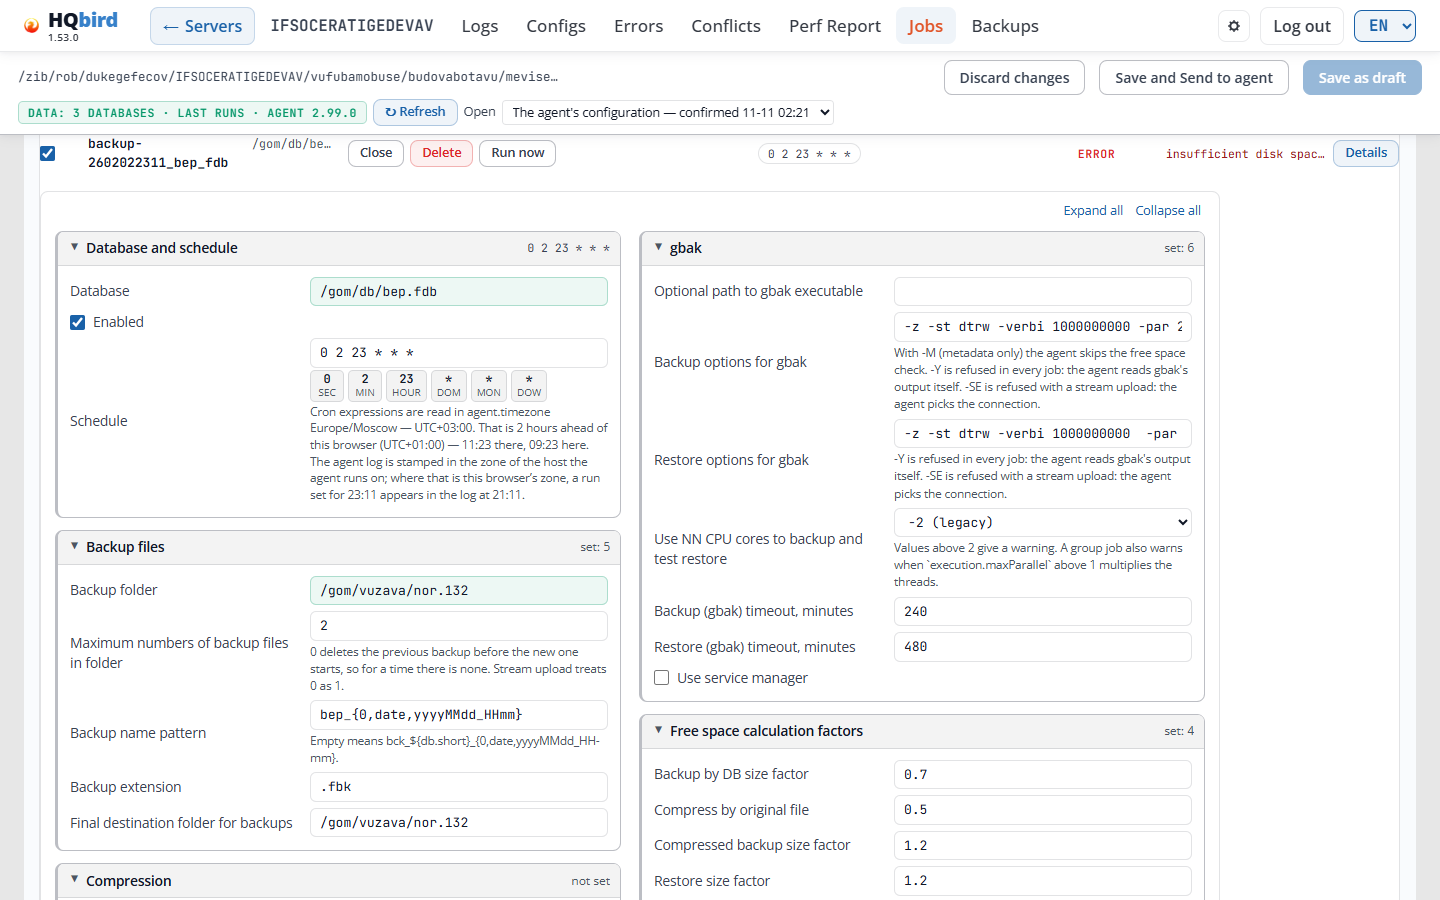
What you see
- The job line: the job id and database, Close, Delete, Run now, the schedule chip, the result (here ERROR with its reason) and Details. The check box at the left turns the job on or off.
- Expand all and Collapse all.
- The groups. In the picture: Database and schedule (the database, the Enabled box and the schedule fields), Backup files, Compression, gbak and Free space calculation factors. After the backup is lower on the form.
How the groups work:
- Click a group title to fold or open it. Expand all and Collapse all do every group. A folded group shows a short summary in its title: the values that matter, not set, or set: N (N fields have a value).
- Rare groups are under More settings. The last group, All fields — N more not on the legacy dialog, has the fields that no other group shows.
- A group with an empty required field (red) or a warning (yellow) opens by itself, and its title shows how many fields are marked. An empty required field has a red frame and the word required.
- A group about one feature has its switch in the title: S3 streaming, file transfer, test restore, disconnect before sweep. Off greys the fields and keeps their values.
Database list. The database field offers the databases that the agent
found and those that databases.conf names, with their aliases. On Firebird
2.5 the aliases come from aliases.conf. So you can
pick a database that nobody has attached yet. The list leaves out the work
files of a backup-restore cycle (names with 4replace in the last extension,
for example employee.fdb.orig4replace_1). When nothing matches, the list
says no database matches, or no databases seen yet when the agent sent
no database list.
Group backup forms (vbackup, nbackup, nbackup dump) have Auto-exclude individual backups: a database that has its own (individual) backup job is left out of the group job. It is on when the job has no value. In the nbackup forms it is marked amber when it is off. Under the include and exclude masks the form says what a mask is matched against, and what an empty include list means for that job.
The nbackup and dump group forms have these lists:
| Field | Values |
|---|---|
| Order | Smallest database first (sizeAsc), Largest database first (sizeDesc), By file path (path). An old value lastBackupAge shows as lastBackupAge - works as sizeAsc. |
| Connection checks | auto - check when the database attaches, skip - no checks, require - no backup when a check fails. |
The vbackup and nbackup group forms have Orphan policy: keepDays - keep for the days below, keepForever - keep and deleteImmediately - move aside at once. Orphan keep (days) is greyed out unless the policy is keepDays. In the vbackup group form, Connection checks is a text field marked to be implemented: the vbackup group job does not read it. The vbackup group form does not offer Order, Continue on error, Skip database if locked and Fair round robin, because the vbackup group job ignores them. A configuration that has them keeps them.
In the nbackup forms, Backup level this cron fires is a list: 0 - full, 1, 2, 3, 4. The keep counts stand next to the schedule of each level, with Add a job for level N. An advanced group job shows all five levels. Compression level and the extension of the compressed file show only when the format is Deflate.
Schedule mode of an nbackup job: a simple schedule, an advanced cron per level, or Plan (rules for all levels). A new job starts in plan mode. See nbackup plan mode.
Each list starts with (default): then the job has no value and the agent uses its default.
Compression. A backup job has the list Compress backups (or
Compress backup) with these values, in this order: No compression,
Zip, gz, zstd, Deflate. A job with no format uses Deflate.
Zip, gz and zstd need fbagent 2.75.0 or newer; an older agent ignores the
choice and uses Deflate. zstd is faster and smaller than Deflate. To open
a zstd file, use zstd -d or 7-Zip 24 or later.
Compression level works only for Deflate. For the other formats it is greyed out. Its values: Default (1, fastest), 1 - fastest, 2 to 5, 6 - as before 2.6, 7, 8, 9 - smallest file. A stored 0 shows as Default. A stored level above 9 shows with (legacy) until you pick another one.
Backup name. When the backup name is empty, the field shows the default name as a hint, and the job gets the default of the agent it runs on.
Test restore. A backup job with Check test restore shows under the
field where the test database will be created. A bare file name, for example
test.fdb, goes into the backup folder. The job’s Last outcome then has a
Test restore row: the result (ok, failed, skipped, not run), the gbak
restore command with Copy, the exit code, the duration, the error, and the
source and target files (fbagent 2.85.0 or newer).
A new vbackup job (individual or group) made with + Add job gets -rep
in its restore options. Then gbak overwrites the test database that the
previous run left. Existing jobs keep their options.
Commands and Test restore bands. The Commands band of a job shows the two newest commands that the agent started. Show more shows up to 50. The Test restore band shows the two newest test restores, each with its backup and restore command. Will be created shows the real test restore folder of the agent.
Options the agent refuses. The agent refuses a vbackup job with the gbak
option -Y, and a job with -SE and a stream to S3. The form marks such an
option. For an agent 2.99.0 or newer:
- A new vbackup or nbackup job with such a setting is saved with Enabled off. The message after the save names the job and the reason. An older agent refused the whole file.
- A job that is enabled in the live file is not turned off: the save is blocked. Fix the setting first.
- The Problems tab shows such a job in amber, and Run now is off for it, with the reason in its tooltip.
An empty or repeated job id also blocks Save.
Backup encryption. The vbackup individual and group forms have Encrypt
(AES-256) with a list of keys. It works only with the Zip format. You
make the keys on the Settings tab (see
Settings tab). An agent older than 2.94.2 has no
backup_encryption: the switch is off, and its tooltip says why.
Service files. Under the job id, a backup job shows Service files: <folder>: where the agent keeps the job’s status, reports, logs and journal (fbagent 2.88.0 or newer). The id of a saved job is read-only, because the folder is named after it: a new id would be a new job with no history.
Deleted jobs. When you delete a job and add a new one at the same place, the new job does not show the last result or the commands of the deleted job. The editor also never gives a new job the id of a deleted job whose history the agent still keeps (30 days).
Backup-restore cycle form
A backup-restore cycle makes a backup of a database, restores it beside the
database and then replaces the live database with the restored copy. It works
in the folder of the database and always shuts the database down full
before the swap.
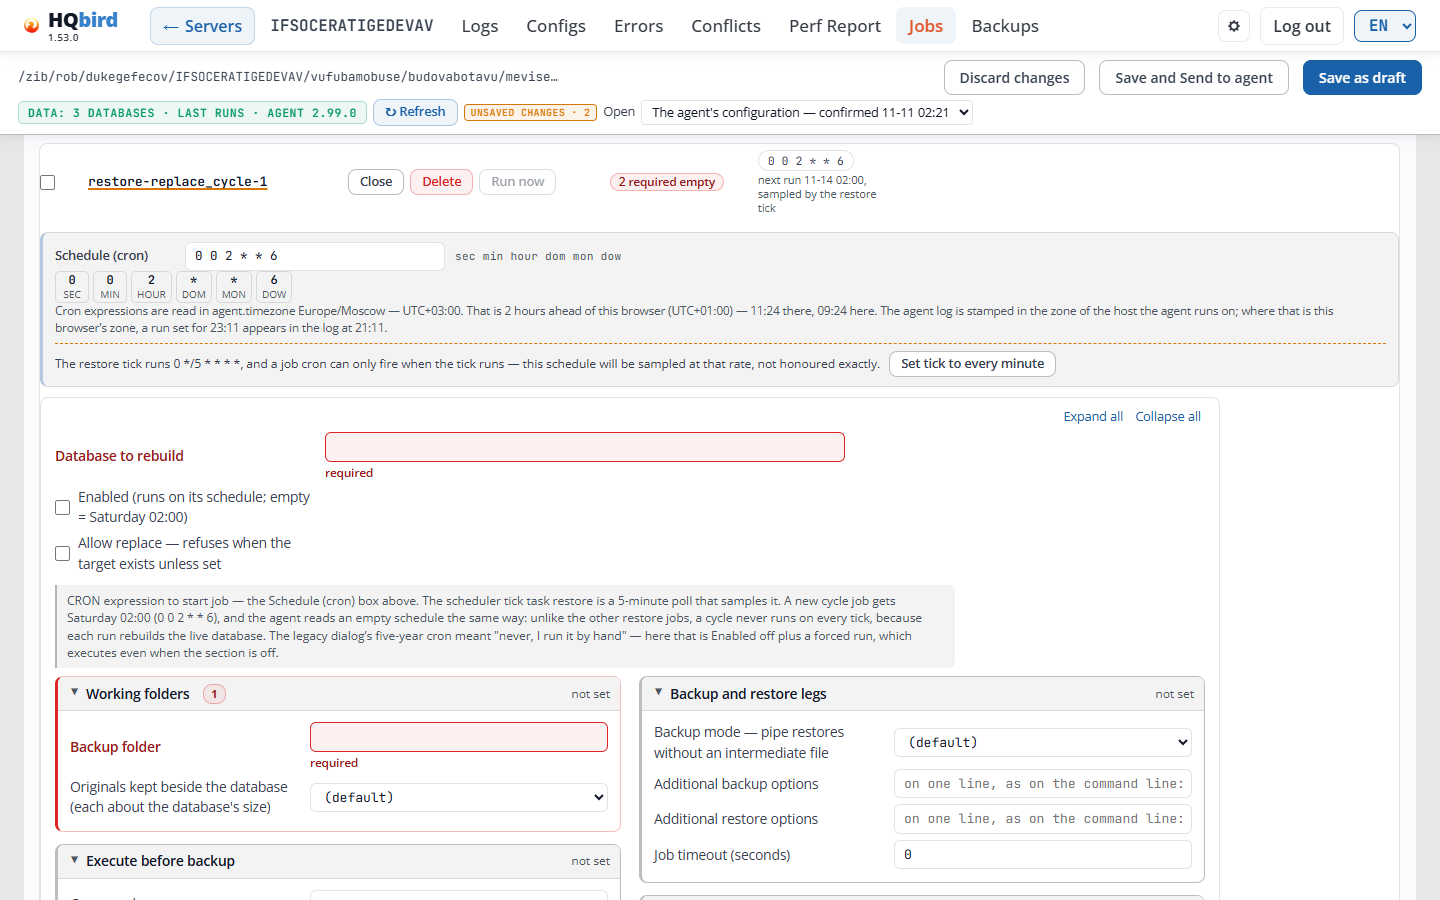
The picture shows a new job right after + Add job. Nothing is saved yet: the header shows the chip UNSAVED CHANGES · 2.
What you see
- The job line: the job id (here
restore-replace_cycle-1), Close, Delete, Run now, 2 required empty, and the schedule chip0 0 2 * * 6with the next run (“next run 11-07 02:00, sampled by the restore tick”). - The Schedule (cron) box with the six cron fields and the time zone note.
- The tick note. It shows when the tick of the task is not every minute.
Here the
restoretick runs0 */5 * * * *, so the job cron can fire only when the tick runs. Set tick to every minute changes the tick of therestoretask to0 */1 * * * *in the editor. Save the change to send it to the agent. - Expand all and Collapse all.
- The top fields: Database to rebuild (required), Enabled (runs on its schedule; empty = Saturday 02:00) and Allow replace — refuses when the target exists unless set, with a note about the schedule.
- The groups Working folders, Execute before backup, Backup and restore legs and Execute after restore. A group with empty required fields has a red frame and a red count next to its title.
The groups:
| Group | Fields |
|---|---|
| Working folders | Backup folder: where the backup file goes. Required unless the backup mode is pipe. Originals kept beside the database (each about the database’s size): a list from 1 to 10. (default) is the agent’s default, 1. |
| Execute before backup | A command that runs before the backup, its parameters (one per line), a timeout and whether the cycle continues when it fails. |
| Backup and restore legs | Backup mode — pipe restores without an intermediate file: (default), file or pipe. Additional backup options and Additional restore options: the gbak options on one line, as on the command line, for example -p 16384 -bu 2048. Job timeout (seconds). |
| Execute after restore | A command that runs after the restore. |
| Shutdown (under More settings) | Shutdown grace (gfix -force seconds, default 120). |
| Disk space preflight (under More settings) | Minimum free space (bytes) and Require free space as a factor of DB size. |
| Shared with the other restore kinds (under More settings) | Fields of the restore jobs that a cycle does not need: Source path (a cycle backs the target up itself), the source job id and Restore mode (the cycle always swaps). |
| Identity (under More settings) | Kind (must match its array): read-only. The job id. |
The Additional backup options and Additional restore options fields are one line of text for an agent with configuration schema 30 or newer. For an older agent the editor stores them as a list, because that agent reads only a list.
Schedule of a cycle. A cycle job runs on its own schedule, not on every
tick of the restore task:
- + Add job writes
0 0 2 * * 6(Saturday 02:00) into the new job, and the job starts disabled. - An empty schedule also means Saturday 02:00 for fbagent 2.86.0 or newer. The job line then shows DEFAULT with this cron.
- An agent older than 2.86.0 runs a cycle with an empty schedule on every
restoretick (every 5 minutes), and each run replaces the live database. For such an agent, always write a schedule into the job. - The safest way is to keep the job disabled and start it with Run now. A forced run works also when the job or its section is off.
nbackup plan mode
In plan mode one nbackup job holds the rules of all its levels. The individual and the group incremental backup forms have it. A plan job needs fbagent 2.98.0 or newer: the editor does not save it for an older agent.
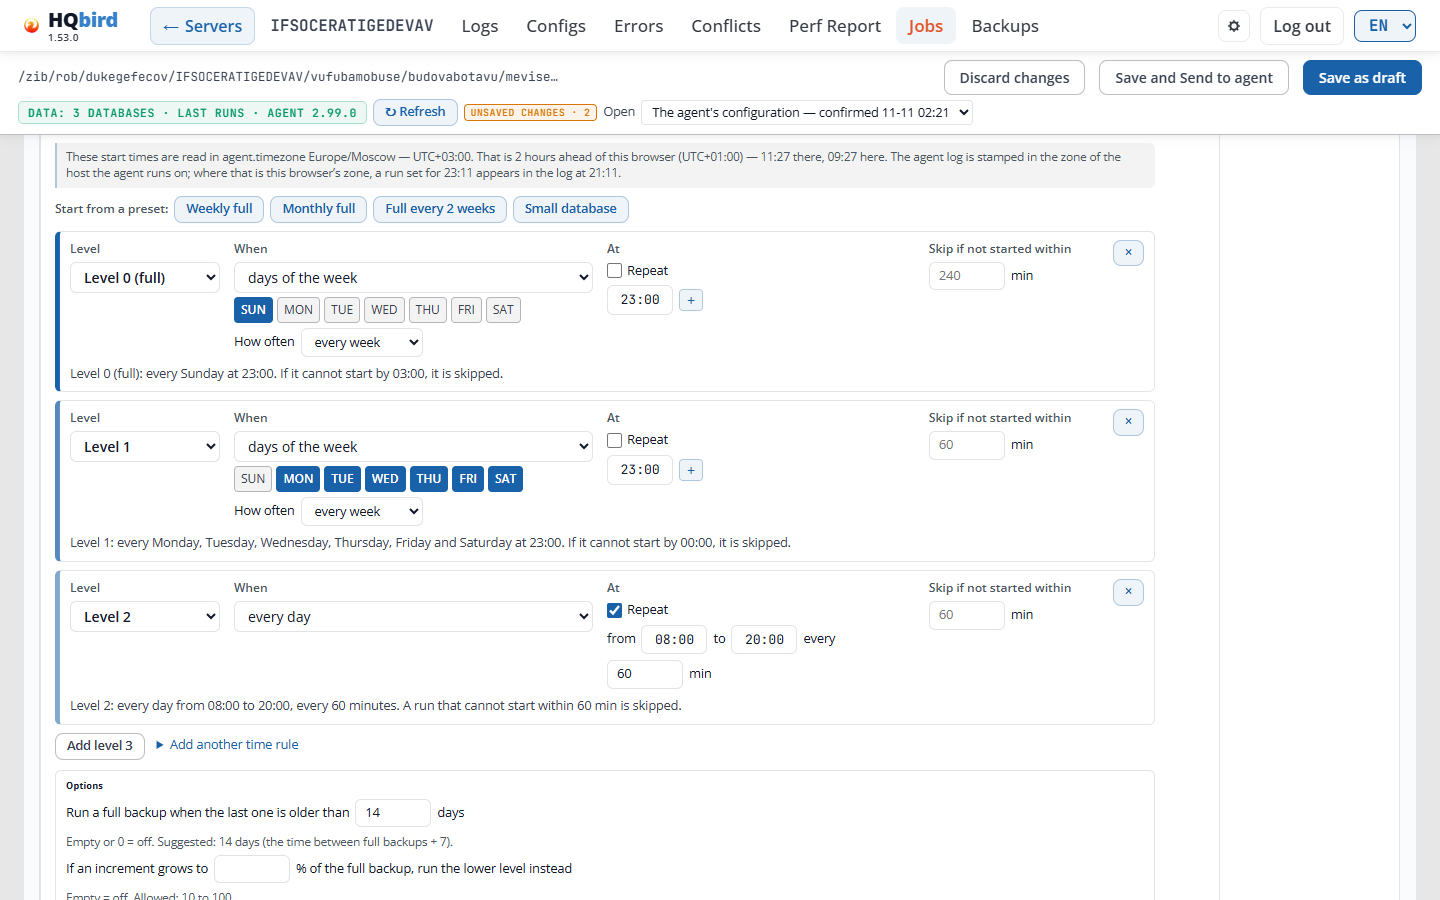
What you see
- A note: the start times are in
agent.timezone, with its offset as a number, for example “Europe/Moscow — UTC+03:00”, and the time in your browser. - Start from a preset: Weekly full, Monthly full, Full every 2 weeks, Small database. A preset fills the rules.
- One box per rule:
- Level: Level 0 (full), Level 1 to Level 4.
- When: every day, days of the week, Nth weekday of the month or days of the month, with the days and How often (every week up to every 4 weeks).
- At: the start time in 24-hour form (
HH:MM), in every browser. + adds a second time. Repeat gives from, to and every N min instead. - Skip if not started within N min: the start window. A run that cannot start in it is skipped.
- × removes the rule.
- The line under the box says the rule in words, for example “Level 1: every Monday … at 23:00. If it cannot start by 00:00, it is skipped.”
- Add level N and Add another time rule.
- Options: Run a full backup when the last one is older than N days (empty or 0 is off) and If an increment grows to N % of the full backup, run the lower level instead (10 to 100; empty is off).
Retention can keep whole cycles: a level 0 backup with its increments.
Preview. Under the options, the preview shows when the plan runs.
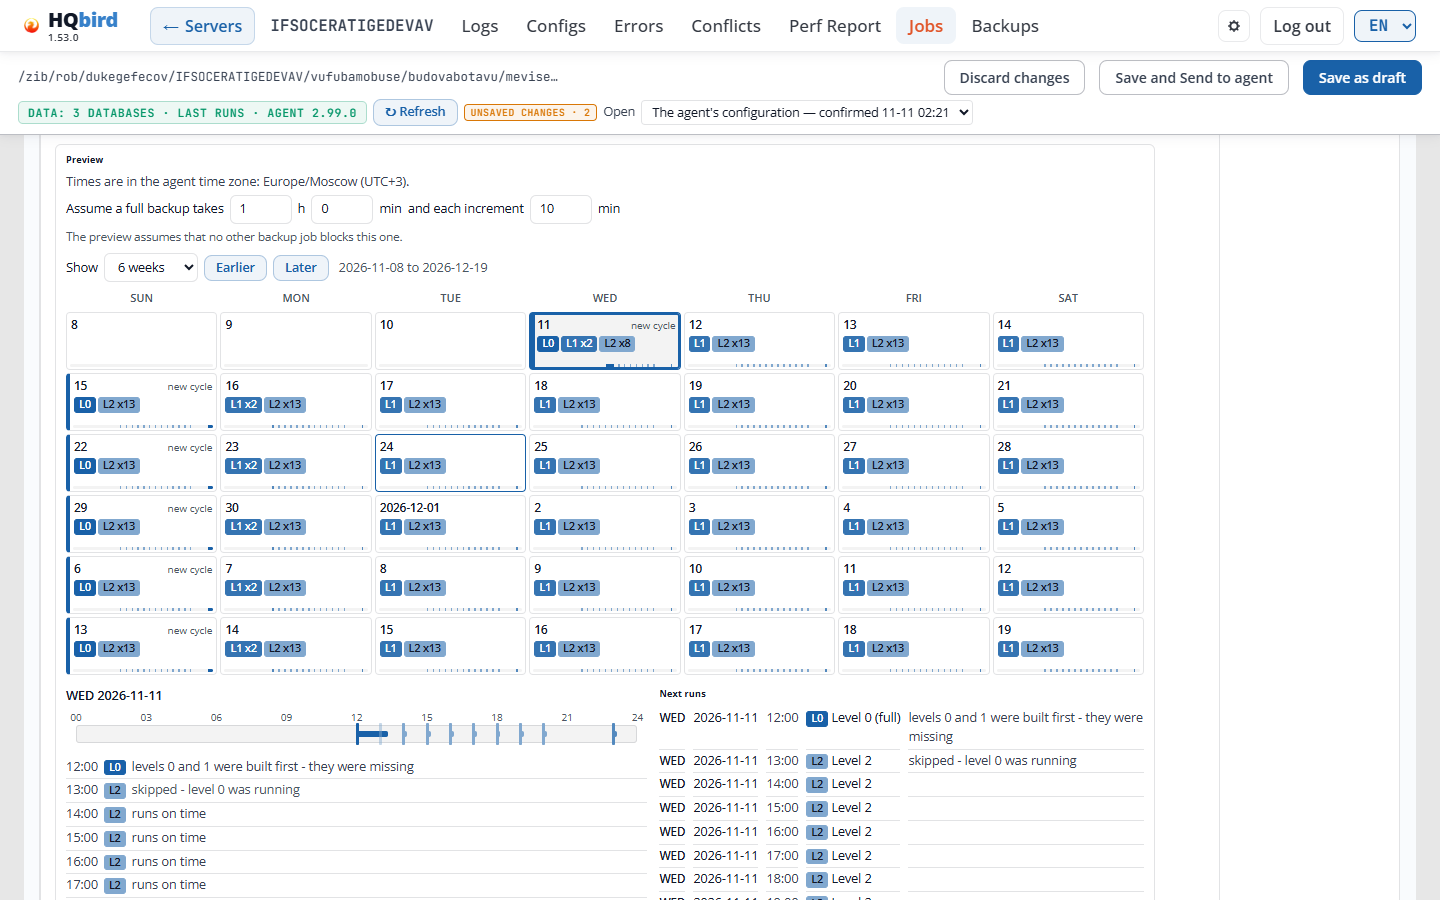
- Assume a full backup takes … and each increment …: how long the runs last. The preview assumes that no other backup job blocks this one.
- Show 4 to 12 weeks, with Earlier and Later. The calendar shows
6 weeks by default. Each day shows its runs, for example
L1orL2 x13. new cycle marks the day of a level 0 backup. - Click a day to see its runs on a 24-hour line and in a list, with the reason for each run, for example “runs on time” or “skipped - level 0 was running”.
- Next runs: the next runs with their level and reason.
- In the retention part, when you keep a number of cycles, a line shows Expected disk use (it is unknown until the first backups run). The Now on disk box shows the backups that are on the disk now.
Read-only accounts can use the calendar preview too.
Agent switches
Some switches decide what the agent measures. They are in the section fields of their line on the Jobs tab: open the line and click the section button. All three are on by default.
| Switch | Line and key | What it does |
|---|---|---|
| CPU and memory by program | Host CPU / RAM, system_metrics.programs |
Adds the CPU and memory of Firebird, the agent and the busiest other programs to each host CPU and memory record. Only names leave the host, no command lines or users. |
| Memory by service | Host CPU / RAM, system_metrics.memory_by_service |
Adds who holds the RAM: on Linux the services (cgroup v2 memory), on Windows the programs, and the cache, kernel, swap and commit of the host. On Linux it also tells how much of each attached database file the OS cache holds. |
| Disk IO by service | Disk IO, disk_io.by_service |
Splits the bytes of each measured disk by service: Firebird, the agent and the busiest others. Linux needs IO accounting on (cgroup v2 io.stat). Windows uses an ETW session. |
The section button appears only when the configuration has that section. These switches feed the CPU usage details, Who uses memory and Who uses the disk cards on the dashboard.
Settings tab
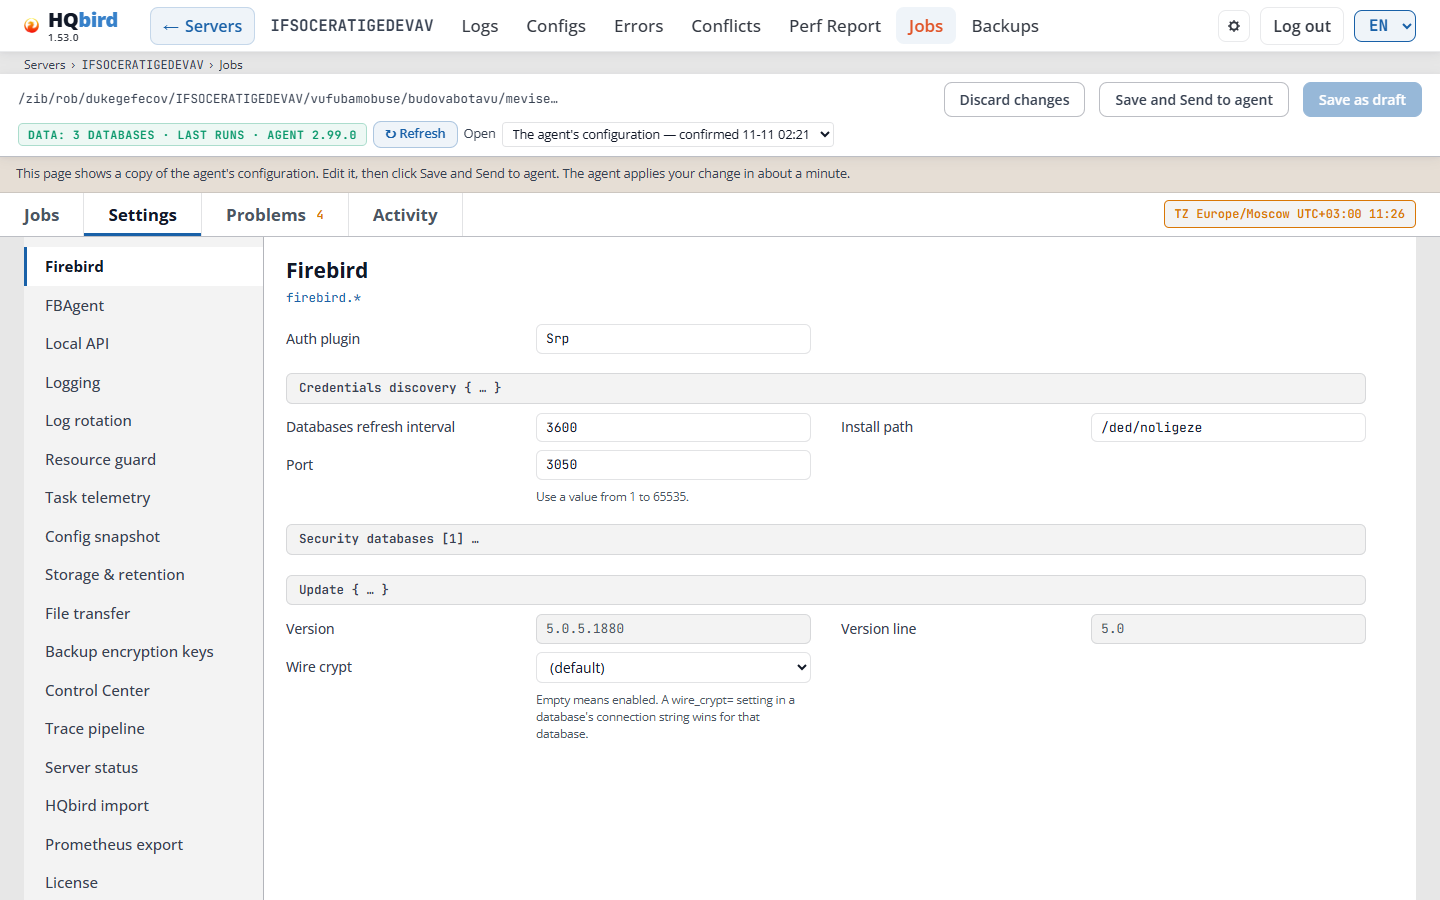
What you see
- The left list with every section of the configuration: Firebird, FBAgent, Local API, Logging, Log rotation, Resource guard, Task telemetry, Config snapshot, Storage & retention, File transfer, Backup encryption keys, Control Center, Trace pipeline, Server status, HQbird import, Prometheus export, License, Run now, Client versions and Managed products.
- Under the list: catalog · schema, the configuration version that the
editor knows (for example
catalog v1 · schema 33). - At the right: the fields of the selected section, under its title and key
(for example Firebird
firebird.*).
How the fields work:
- Each field shows its name and, when needed, a hint under it.
- Point at a name to see its tooltip. The mouse pointer changes to the help
pointer (an arrow with a question mark) where a tooltip is. The tooltip
starts with what the field does. Then come a note, the default value and,
last, the key in the file, for example
firebird.install_path. - A field with a fixed set of values is a list. The first entry is (default), followed by the default value when the editor knows it. A stored value that is not in the list stays as it is.
- A line with
{ … }is a group of fields. A line with[n] …is a list with n entries. Click the line to open it. - Grey fields are read-only. The agent fills them, for example Version.
- Fields marked base64 hold a password in base64 form, the way the agent reads it. Type the password in plain text; the editor converts it (see Passwords).
- In File transfer, each target shows only the fields it has. The
Add field… list under a target offers the fields that it does not have
yet, for example
checksum_mode,sseandsse_kms_key_id. A field you pick starts at its default value, or empty when it has no default.
Backup encryption keys holds the keys for encrypted backup archives (see Backup encryption under Job forms).
- You can generate a new key there. Its password shows once: copy it and keep it in a safe place. Without it the backups cannot be opened.
escrow_public_key: a public key for a copy of the keys (escrow). A snapshot with escrow offers Download escrow.
Resource guard: the default CPU threshold is 30 (configuration schema 33).
Managed products also shows how often a healthy agent checks for a new release of fbagent, HQ Monitor, fbmcp and Firebird, and how often it checks a staged node or RCM that is not installed yet.
The Server status section has the limits of the server status findings.
Two of them are for Firebird memory pressure:
server_status.thresholds.firebird_memory_pressure_pct.warning (10) and
.serious (25). The value is the share of time that Firebird waited for
memory in the last 10 minutes, in percent (Linux PSI of the Firebird
service). At or above the value the status is warning or serious. Without
PSI the agent does not judge it.
Security databases (in the Firebird section) lists the security
databases of the server. The default entry is the server’s own security
database. Its Credentials are the login that the agent uses for the
server. When they are empty, the agent uses the Firebird defaults (SYSDBA and
masterkey). A private security database, or a database that checks its own
logins, gets an entry of its own.
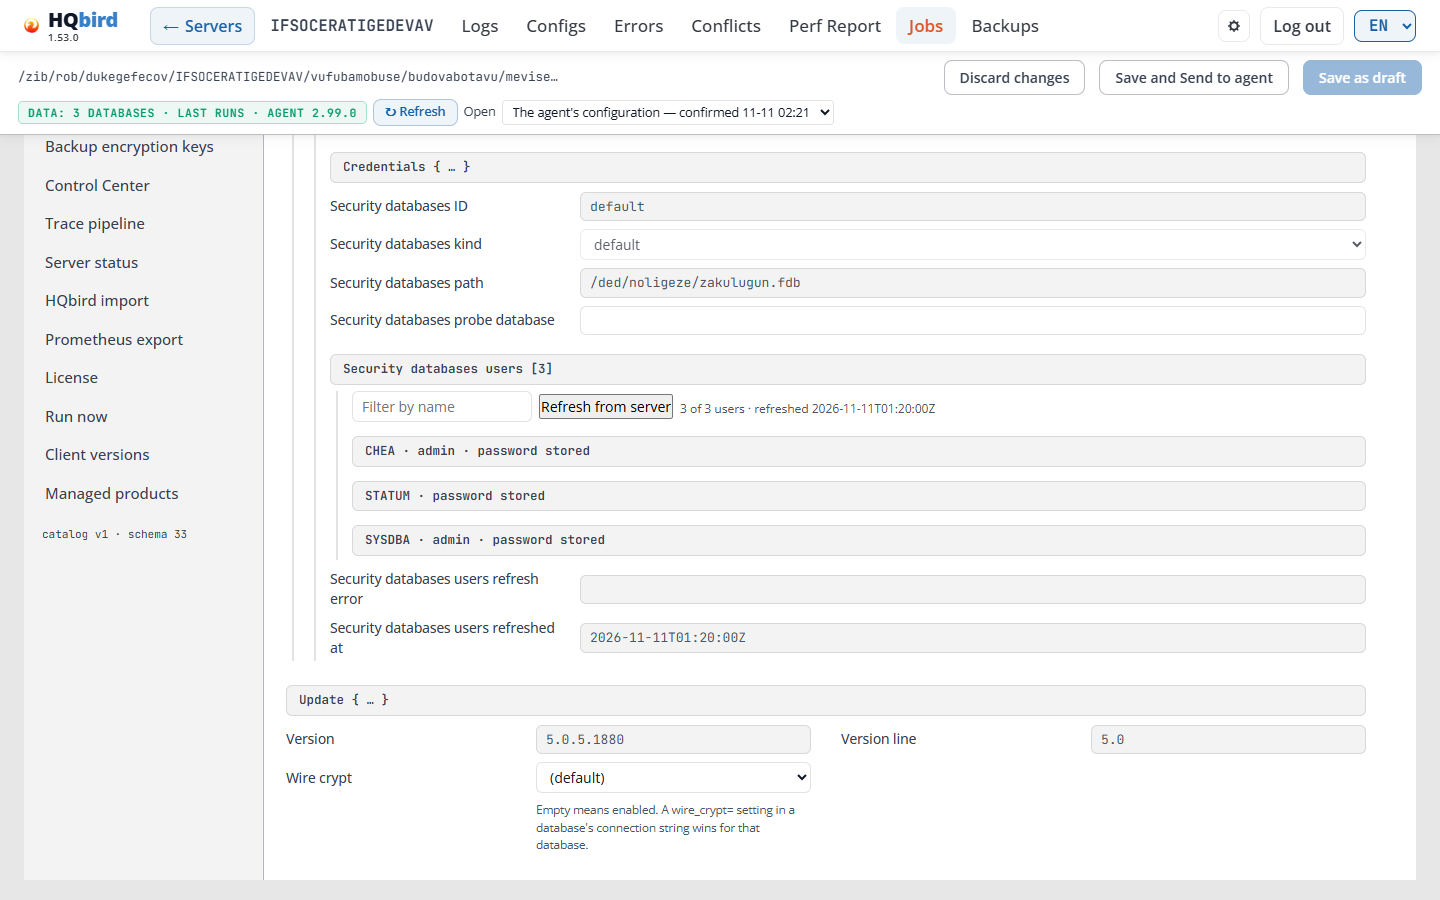
- ID, kind and path are filled by the agent from
databases.conf. - Users lists the users of that security database, 50 per page. Filter by name finds a user. The line above the list says how many users are shown and when the list was read, for example 3 of 3 users · refreshed …. The fields users refreshed at and users refresh error show the time and the error of the last refresh. A user can have the marks admin, inactive, missing on the server and password stored.
- Refresh from server reads the list again. In local mode the agent reads
it at once, and the page shows the new list. In remote mode the button sends
a Run now request of the agent job
refresh_security_users, and the new list arrives with the agent’s next configuration snapshot. This needs fbagent 2.79.0 or newer and the right May run jobs on agents. On an older agent the button is greyed out, and its tooltip says why.
Messages you may see
| Message | What it means |
|---|---|
| No users yet: enter the credentials of this security database and refresh from the server. | The list is empty. Set the credentials, then click Refresh from server. |
| No user matches the filter. | No user name contains the filter text. |
| Refreshing reloads the configuration from the agent and discards the unsaved edits on this page. Continue? | You have unsaved changes. Save them first, or they are lost. |
| User list refreshed from the server. | Local mode: the new list is on the page. |
| Refresh requested on the remote agent; the list updates when the agent sends its next configuration snapshot. | Remote mode: wait for the next snapshot. |
| Users refresh failed: … | The agent could not read the users. The text gives the reason. |
| Refresh from server is not available for this remote agent: … | Remote refresh does not work for this agent, for example because it is too old. |
Problems tab
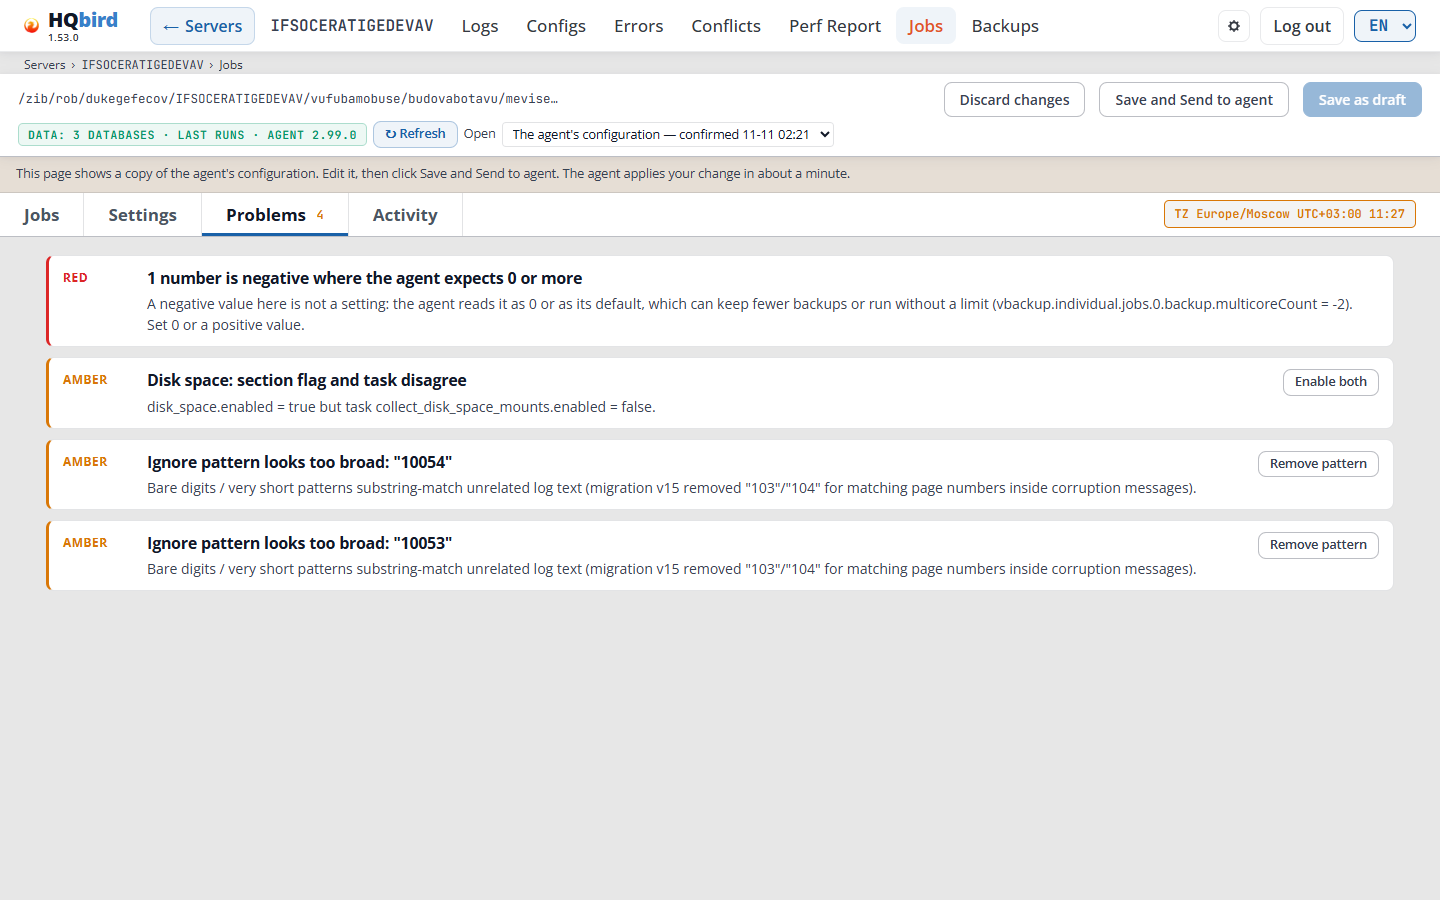
The editor checks the configuration and lists what looks wrong.
What you see
- One card per problem: the level (RED, AMBER or INFO), a title and an explanation.
- A button that fixes the problem, for example Enable both, Disable both, Remove pattern or Set tick to ….
The number on the Problems tab counts red and amber problems; info is not counted. The fix changes the editor only. Save the change as usual.
Some problems that need care:
| Problem | What it means |
|---|---|
| Backup jobs share one folder and name: … | Two enabled backup jobs write backups with the same name into the same folder, so their files cannot be told apart. When the two jobs back up the same database, each job’s retention deletes the other job’s backups. The job cards mark the folder and name fields. Give each job its own folder or name. |
| nbackup level without level 0: … | An nbackup job of level 1 or higher needs a level 0 or simple job of the same database and folder. The agent does not run this job until there is one. |
| … section flag and task disagree | One switch of the job is on and the other is off. Enable both or Disable both fixes it. |
| Restore config job “…” runs on every tick | A restore job without its own schedule runs on every tick of its task. Give it a schedule, or keep it disabled and use Run now. |
| Ignore pattern looks too broad: “…” | A pattern in server_status.firebird_log.ignore_patterns is so short (for example bare digits) that it also matches other lines of firebird.log. Remove pattern removes it. |
| … is incomplete | Required fields are empty. When you save, the editor turns the job off. |
When the configuration has no problems, the tab says No problems detected in this configuration.
Saving: local mode (console beside the agent)
The console opens the agent’s live agent_config.json.
- Save writes the change to a file that the agent reads at its next check.
- Save and apply now saves and tells the running agent to reload now. The button appears only when the agent answers; then it is the main (blue) button at the right end. The message Applied live stays on the page after the save.
Saving: remote mode (collection center)
The console opens the newest configuration snapshot that the agent sent.
- Save as draft keeps the change on the console. Nothing is sent to the agent. The button is greyed out while there is nothing to save.
- Open lists the agent’s configuration and your drafts with their state: not sent, sent, applied or superseded. A line above the editor tells the state of the open draft.
- Save and Send to agent sends the change to the agent through goafts. The button appears only when the administrator turned delivery on and your account has the right May push configuration to agents. The agent applies the change in about a minute.
Drafts older than 30 days are deleted when they are no longer based on the current snapshot.
Delivery status
After you send a change, its status appears in the editor and in the Server/Agent version/Remote control column on the Servers page.

| Status | Meaning |
|---|---|
| SENT | The change is stored on goafts. |
| TAKEN | The agent downloaded it. |
| APPLIED | The agent applied it. |
| ALREADY SET | The agent already had these values. |
| RESTART NEEDED | Applied, but some sections work only after an agent restart. The tooltip lists them. |
| REJECTED | The agent refused the change. The tooltip shows the agent’s reason. |
| SUPERSEDED | A newer change replaced this one. |
| DRIFT nn′ | No answer from the agent for nn minutes (10 by default). Check that the agent is running. |
| NOT READ | The console could not read the status. |
| HQCenter link is not set | Delivery is turned off on this console. |
Passwords
Type a password in plain text. How the editor stores it depends on the mode:
- Local mode: the editor writes the password base64-encoded into
agent_config.json, because the agent reads it in this form. - Remote mode: the snapshot shows stored passwords hidden. A password you type goes to the agent with the change, and the agent stores it in its own protected form.
When you type a password over plain http, the editor shows a warning that the
connection is not encrypted. The administrator can forbid this; then password
fields work only over https.
Every save, send, password change and job run is written to the audit log with your login name.
Run now
Each job line on the Jobs tab has a Run now button. It starts that job once, as soon as the agent can. The schedule does not change. Backups, restores, sweeps, index recalculation and gfix checks have the button.
- Click Run now on the job line.
- Check the Database box at the top of the dialog. It shows what will run: the database path of a single job, the target and the backup of a restore, or for a group job its folder and Databases ticked: N of M.
- Check the warnings. If the job, its section or its scheduler task is switched off, the job still runs once, and stays off afterwards.
- Set the options if the job has any: a sweep can respect its execution window, and an incremental backup has a level. A group job lists its databases with check boxes, all ticked at first, with Tick all and Untick all. With no database ticked, the start button is off. Add a reason if you like.
- Click Run now. Close closes the dialog and starts nothing.
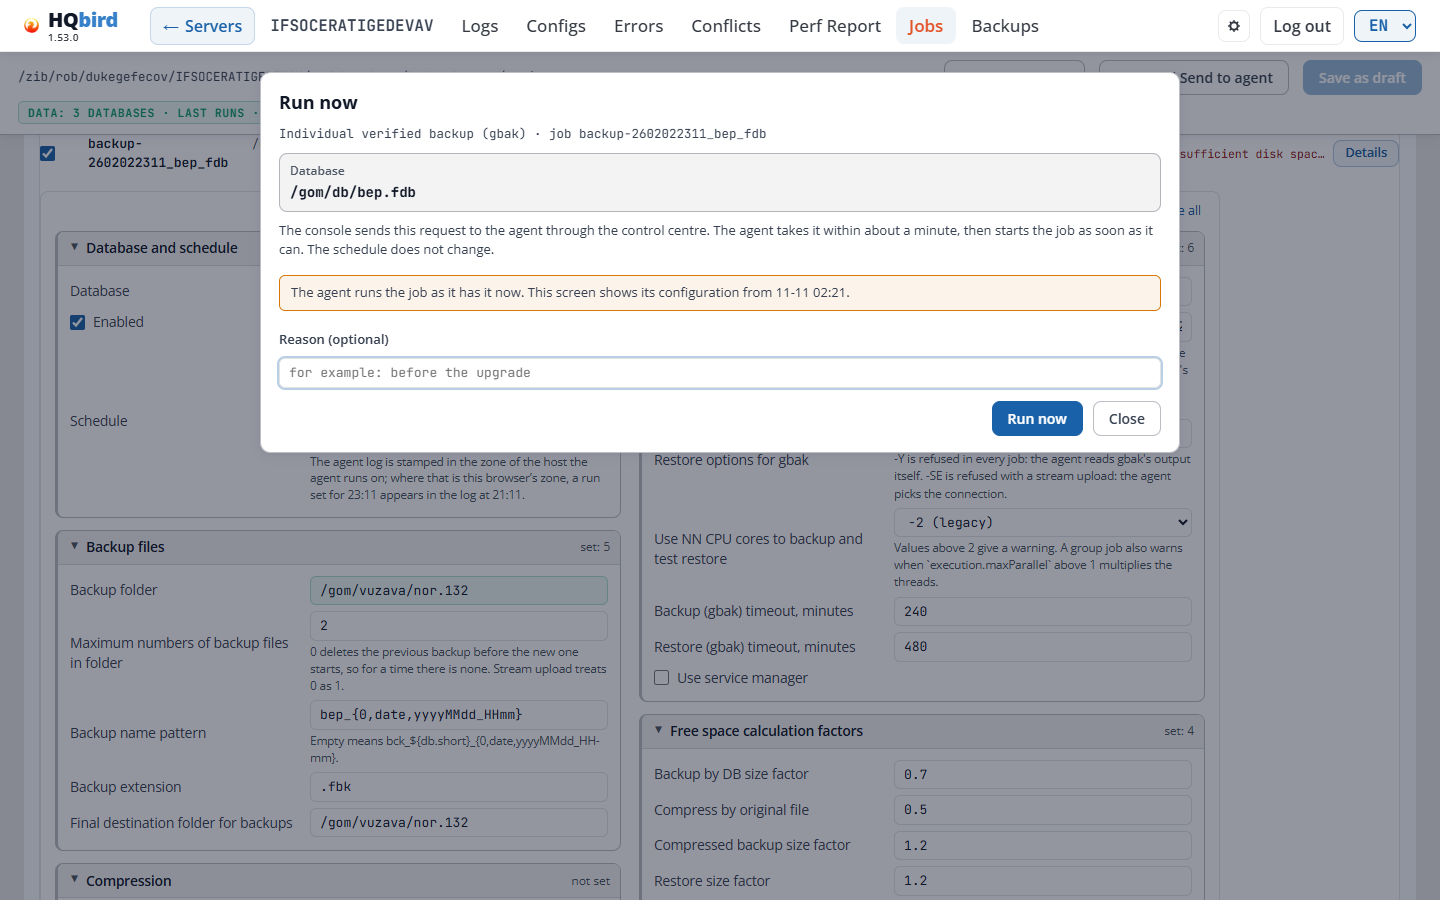
Right after you save a new job, Run now waits until the agent has taken the new configuration, and then starts the job.
The job line then shows the state of the run:

- waiting shows the reason, for example that the database is locked by another job, that the job waits for its execution window, or that there is not enough free disk space.
- Click Cancel run while the run is queued or waiting. A run that has started cannot be cancelled.
- A job that replaces a live database (a restore in replace mode, or a backup-restore cycle) asks you to type the file name of the database before the button works. When the job names no database, type the job id.
In local mode the console starts the job through the agent on the same machine. In remote mode the request goes through goafts, and the agent takes it at its next sync, within about a minute. The button is greyed out when it cannot work, and the tooltip says why:
- Your account does not have the right May run jobs on agents. A job that replaces a database also needs May run jobs that replace a database.
- Remote mode needs the delivery settings and
users_mode=multiple. - The agent switched remote commands off. This is a setting on the agent’s host
(
goafts.remote_commands.enabled;allow_destructivefor jobs that replace a database). It cannot be changed from the console. - The agent is too old. It needs fbagent 2.61.0 or newer.
Job logs
Backup and restore jobs keep the gbak log of each run. When a run fails, the
job line shows the last lines of the log of the step that failed. Details
on the job line lists the logs of the last run, one per step, with
Download log. On a collection center a log arrives with the agent’s data,
usually within 5 minutes of the run.
Backups
Backups shows the backup inventory of the server: every backup file that the agent knows about, and the test restores and restore jobs.
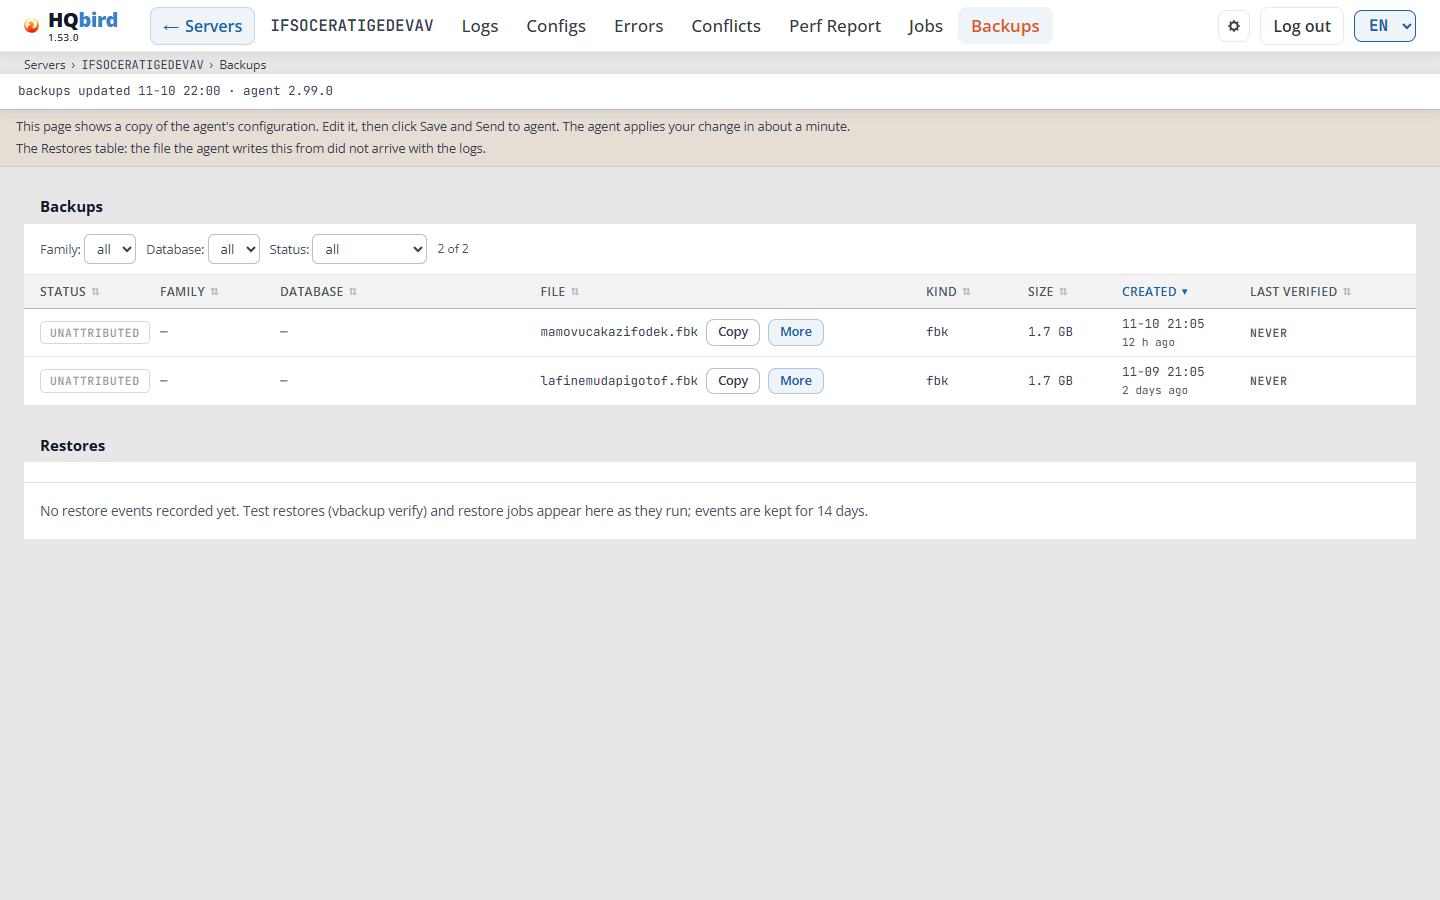
What you see
- The console header with Backups marked, and the breadcrumb
Servers › SRV › Backups. - The header line: backups updated …, restores updated … (only when the agent sent restore data) and the agent version.
- The note line (in remote mode).
- The Backups table with the filters Family:, Database: and Status:, and the count of rows, for example 6 of 6.
- The Restores table with the filters Kind: and Outcome:, and its count, for example 15 of 15. An empty table shows only a message.
Click a column header to sort. A second click changes the direction. The Backups table starts sorted by Created, the Restores table by Finished, newest first.
Backups table
| Column | What it shows |
|---|---|
| Status | OK, MISSING, ORPHANED or UNATTRIBUTED (see below). |
| Family | The backup job type, for example vbackup, and individual or group. — for a file that no job recorded. ⚠ nbackup copyType marks a dump job that made an nbackup file. |
| Database | The database of the backup, for example /data/employee.fdb. — when the file belongs to no database of this server. |
| File | The file name, with Copy (copies the full path) and More (shows the Full path). « Less closes it. Point at the name to see the full path. |
| Kind | The file kind: fbk, nbk, nbackupcopy and others. |
| Size | The file size. |
| Created | When the backup was made, and how long ago. |
| Last verified | PASS or FAIL and the time of the last test restore, or NEVER when no test restore checked the file. |
| Status | Meaning |
|---|---|
| OK | A backup job recorded the file, and it is on disk or in the remote storage. |
| MISSING | A backup job recorded the file, but it is not on disk. |
| ORPHANED | The scan found the file for a database of this server, but no backup job recorded it. |
| UNATTRIBUTED | The scan found a file of no database of this server, for example a file of another server in a shared folder. |
⚠ nbackup copyType: a dump job with copy type nbackup resets the
incremental base of every real nbackup job of the same database. Use
lock_nbackup or lock_sql.
Restores table
| Column | What it shows |
|---|---|
| Outcome | OK, FAILED or SKIPPED. |
| Kind | test (a test restore) or replace (a restore that replaces a database). |
| Family | The job type that made the restore, for example vbackup. |
| Job | The job id. |
| Source | The backup file, with Copy and More. More shows the command with Copy, the exit code, the duration (Took), the database, the target, the skip reason and the Output log and Error log files. |
| Target | The file that the restore created. |
| Trigger | on schedule or forced run. |
| Finished | When the restore ended, and how long ago. |
| Error | The error or the skip reason, for example the restore target is a live database or not enough free space at the restore path. |
The page shows the first 500 rows of a table. Show all N rows shows the rest. Restore events are kept for 14 days.
Messages you may see
| Message | What it means |
|---|---|
| No backups recorded yet. The inventory fills in as backups run, and fully on the next backup-status reconcile (every 2 hours). | The agent has no backup in its inventory yet. |
| No restore events recorded yet. Test restores (vbackup verify) and restore jobs appear here as they run; events are kept for 14 days. | No restore ran in the last 14 days. |
| This inventory is capped and older entries have been dropped, so what is listed is not everything the agent knows about. | The list has a size limit, and the oldest rows were dropped. |
| Not available in this log tree — see the note above. | The agent data for this table did not reach the console. The note line says why. |
| Could not load … | The page could not read the data. Reload the page. |
Tips:
- Filter Status: by orphaned to find backup files that no backup job recorded, for example files that someone copied by hand.
- A FAIL in Last verified means that a test restore of this file failed. Open More in the Restores table to see the command and the log files.
Activity
The Activity tab shows how the agent’s scheduler tasks ran.
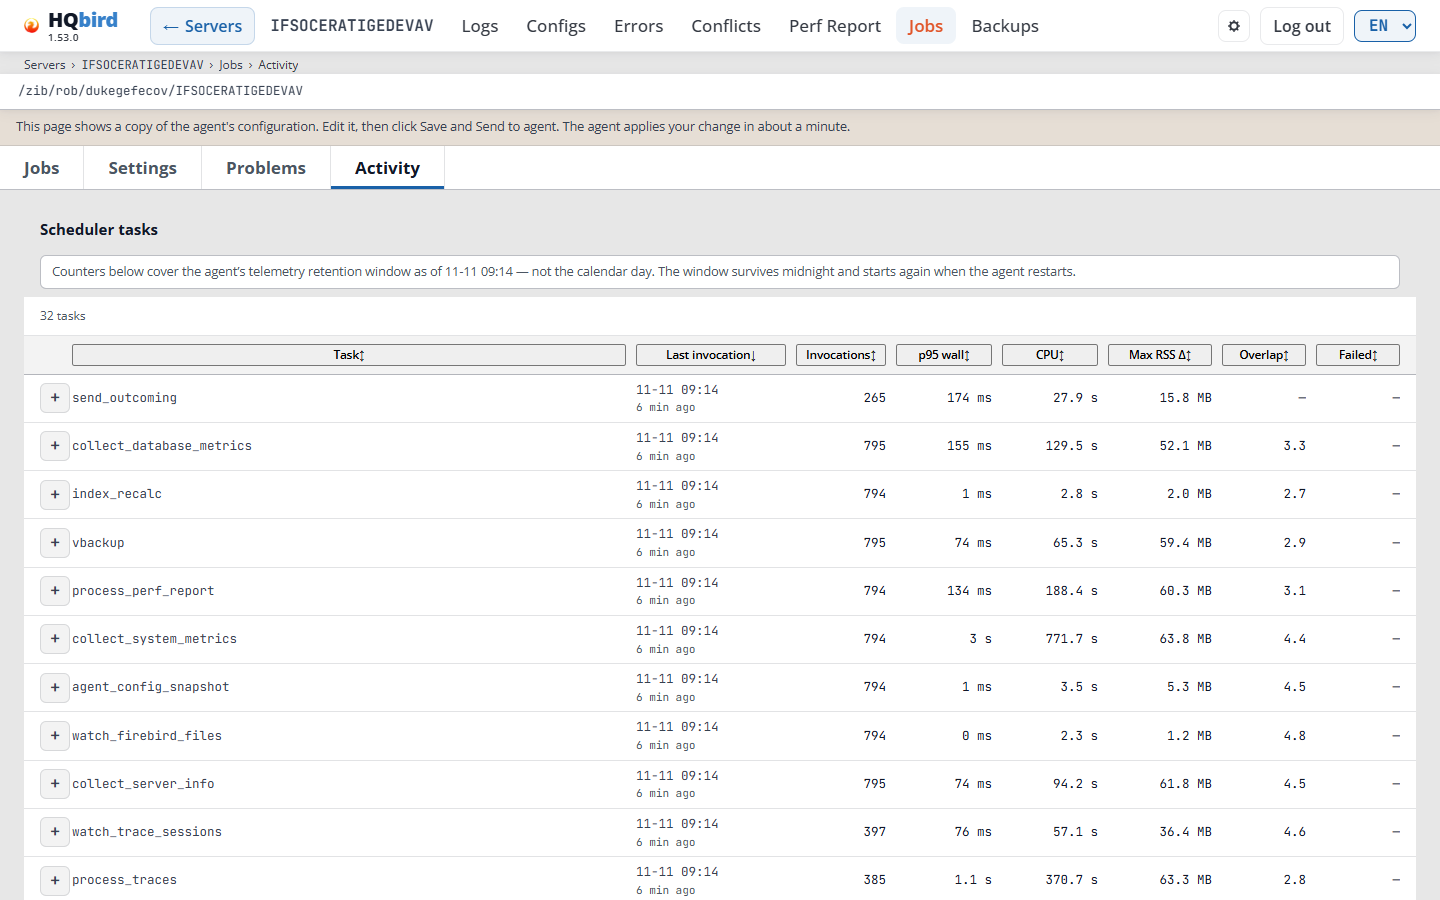
What you see
- The console header with Jobs marked, and the breadcrumb
Servers › SRV › Jobs › Activity. - The data folder of the agent, and the note line (in remote mode).
- The tabs Jobs, Settings, Problems and Activity.
- Scheduler tasks: a note about the time window, then the number of tasks, for example 27 tasks.
- The table of the tasks.
The counters cover the agent’s telemetry window, not the calendar day. The window continues past midnight and starts again when the agent restarts.
| Column | What it shows |
|---|---|
| Task | The scheduler task. + opens the list of its runs. |
| Last invocation | When the task last ran, in agent time, and how long ago. |
| Invocations | How many times it ran in the window. |
| p95 wall | 95% of the runs took this time or less. |
| CPU | The CPU time of all runs, with their child processes. |
| Max RSS Δ | The largest memory growth during one run. |
| Overlap | How many other tasks ran at the same time, on average. |
| Failed | How many runs of the task failed. Point at the number to see the last error. — means none. |
Click a column header to sort. The table starts sorted by Last invocation, newest first.
+ opens up to the newest 100 runs of a task:
| Column | What it shows |
|---|---|
| Started (agent time) | When the run started. |
| Wall | How long the run took. |
| CPU (+child) | The CPU time of the run and its child processes. |
| RSS Δ | The memory growth during the run. |
| Overlap | How many other tasks ran at the same time. |
| Detail | manual run for a run started by hand, the error of a failed run, or other facts. A failed run is red. |
Failed counts failed runs of the scheduler task, not the results of the jobs. The task of a job list ends without an error even when every job under it failed. The job results are on the Jobs tab.
Messages you may see
| Message | What it means |
|---|---|
| No agent data tree was found beside this configuration, so there is no activity to read. | The console has no agent data for this server. |
| This log tree carries no task telemetry. The agent writes it from version 2.0.15 onward; an older agent, or log rotation, leaves nothing here. | The agent sent no telemetry. |
| The newest records are older than this agent’s own cadence would produce. On a console that usually means the log pack has not arrived yet, rather than that the scheduler stopped. | The data is old. Wait for the next log pack. |
| The telemetry files are present but could not be read. | The files are damaged or in an unknown format. |
| No invocations recorded for this task in the window that was read. | The task did not run in the window. |
| Reading this task’s invocations… | The list of runs is loading. |
| Showing the newest N invocations; older ones in this window were not read. | Only the newest runs are listed. |
| N unreadable line(s) were skipped. | Some lines of the telemetry could not be read. |
| Could not read … | The page could not read the data. Reload the page. |
A task with a large p95, CPU or memory value is the first one to check when the agent uses too much of the server.
10. Licenses
The Licenses button on the Servers page opens the License page (/license).
Every signed-in user can read it, for the servers that user may see. The console
only shows licenses and delivers a license file. It never blocks
anything: the agent checks the license, and goafts stores and hands it out.
The server list
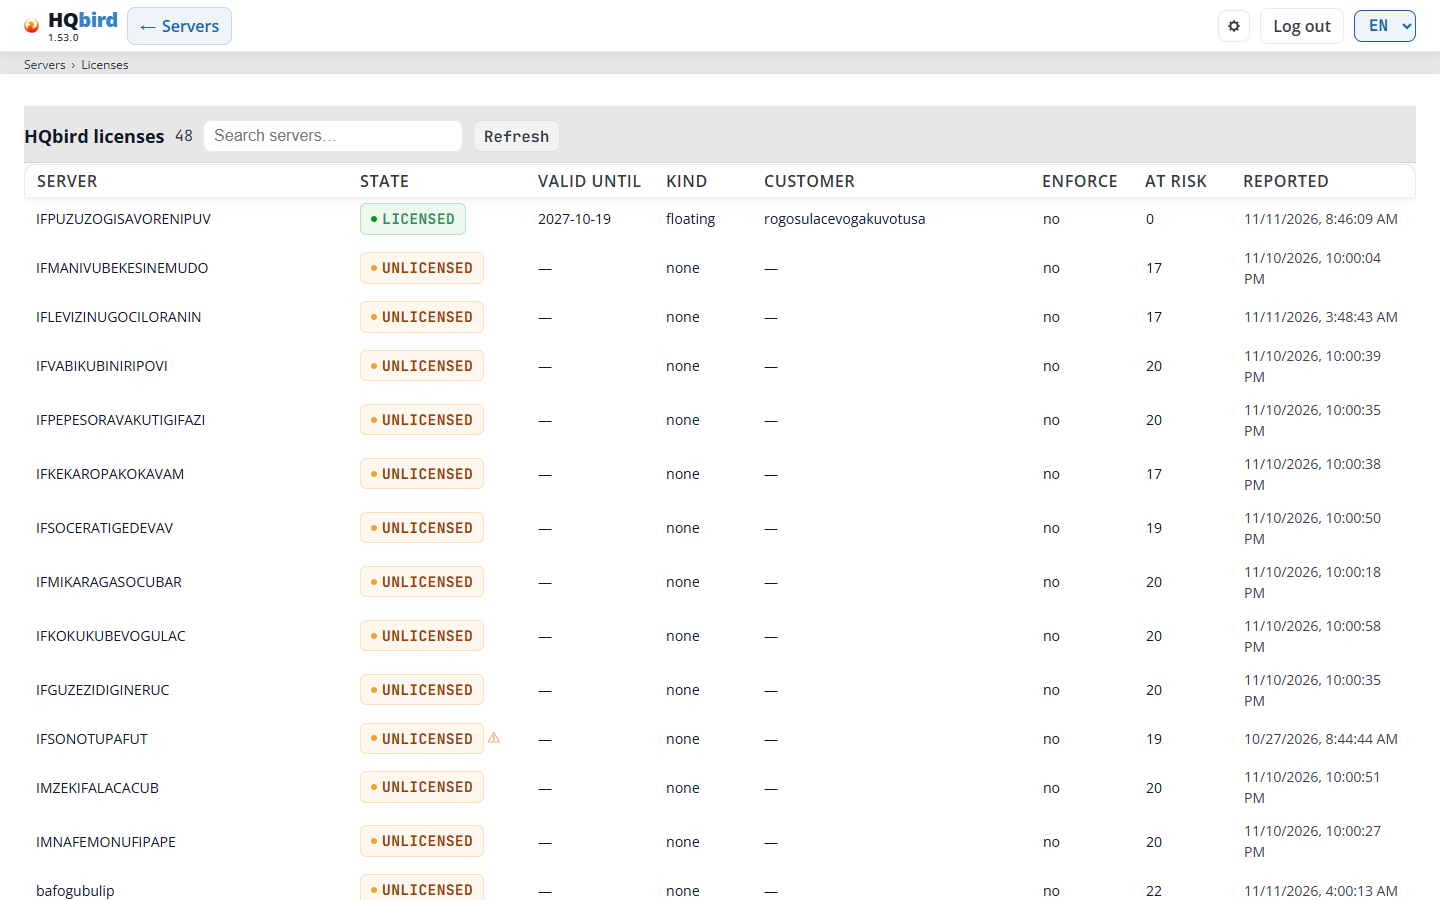
What you see
- The header with ← Servers, and the breadcrumb line
Servers › Licenses. - The license banner, only when a server needs attention (see The license banner).
- An error line. It is empty when the page loads without problems.
- The title HQbird licenses with the number of servers, the search field Search servers… and the Refresh button.
- The table: one row for each server you may see, sorted by name.
- Under the table: the server you clicked (see One server).
| Column | What it shows |
|---|---|
| Server | The server (agent) name. |
| State | A badge: LICENSED (green), GRACE or UNLICENSED (amber), INVALID (red), TRIAL, or NO DATA. A ⚠ sign after the badge means that the last report is more than 3 days old. |
| Valid until | The date that matters for this state: the expiry date of a license, the end of the grace period, the end of stage 1 or of the trial, or the latest end of the trial. When 60 days or fewer are left, the number of days follows, for example (12 d). Point at the date to see what it is. |
| Kind | floating, bound to hosts, or none. |
| Customer | The customer of the license. |
| Enforce | yes or no: whether the agent enforces the license. |
| At risk | How many configured jobs need a license that this server does not have. |
| Reported | When the agent last reported licensing, in the local time of your browser. |
A server with no report shows “—” in the date columns. Point at a row to see a short summary: the reason for the state, the customer and license id, and, when it applies, “Enforcement is off: nothing is blocked.” and “Jobs that need a license: 16”.
Messages you may see
| Message | What it means |
|---|---|
| No servers. | No server matches the search, or you may see no servers. |
| ⚠ “The last report from the agent is old: the state shown may be out of date.” | The agent has not reported licensing for more than 3 days. Check that the agent runs. |
Tips:
- Search servers… filters the table by server name. Refresh reads the list and the open server again.
/license?server=SRVopens one server directly. The license banner and the License cell on the Clusters page use this link.
One server
Click a row. The details of that server open under the table.
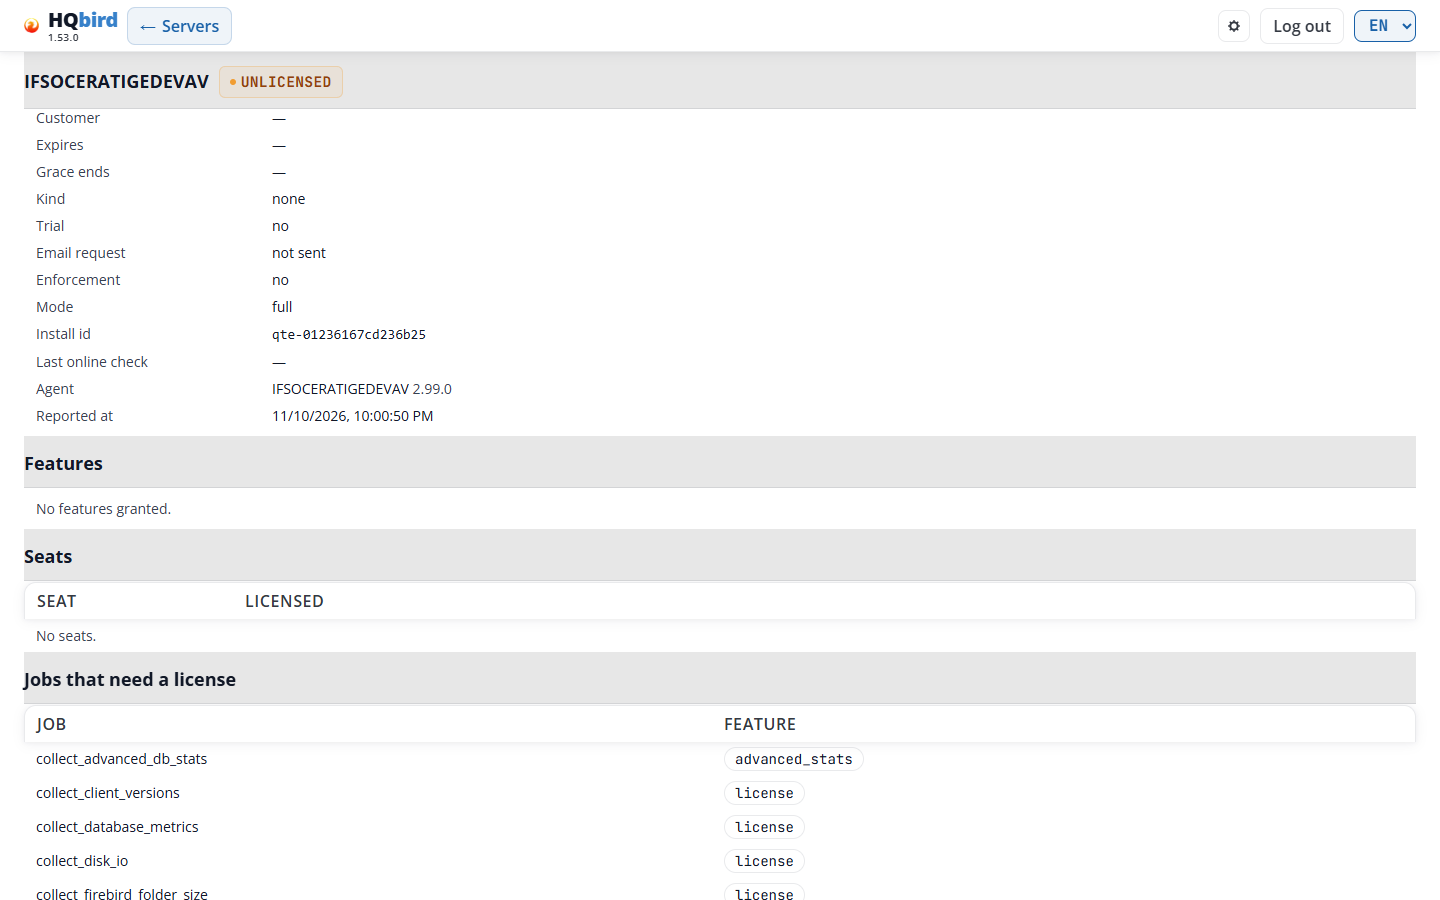
What you see
- The server name and its state badge.
- Notes, only when they apply: no report from the agent, an old report, or “Enforcement is off: nothing is blocked. The jobs listed below would stop when it is switched on.”
- The list of license fields (table below).
- Features: the features the license grants, as small labels.
- Seats: the seats the license grants.
- Jobs that need a license: jobs that are configured but not allowed by the current state. With enforcement off they still run. The list shows what would stop.
- Under these, for a trial: the section Extend the trial to 30 days (see The trial).
- The section to install or upload a license (see Install a license), and the list of Licenses in goafts when you may use it.
| Field | What it shows |
|---|---|
| State | The state badge. |
| Reason | Why the server has this state, in words (see the messages below). |
| License id, Customer | The license and the customer it was issued to. |
| Expires, Grace ends | The expiry date and the end of the grace period. |
| Kind | floating, bound to hosts, or none. |
| Trial | yes or no. For a trial: when it started and when it ends. |
| Trial stage | stage 1 (no email needed), stage 2 (email and code), or over. Only during a trial. |
| Stage 1 ends, Trial ends at the latest | The trial dates, with the days left. Only during a trial. |
| First license accepted | When the agent accepted its first license. Only when the agent reports it. |
| Email request | The state of the trial email: not sent, being checked, code sent by email, code accepted, waiting for the trial license, trial license installed, or closed with the reason. |
| Enforcement | yes or no. |
| Mode | The agent mode: full or license only. |
| Install id | The identity of the host. A host-bound license is issued for it. |
| Last online check | When the agent last reached the license server. |
| Agent | The agent id and its version. |
| Reported at | When the agent wrote this report. |
| Column | What it shows |
|---|---|
| Seat | Seats table: the kind of seat. |
| Licensed | Seats table: how many seats of this kind the license grants. |
| Job | Jobs that need a license table: the job id. |
| Feature | Jobs that need a license table: the feature the job needs. |
Messages you may see
| Message | What it means |
|---|---|
| The agent of this server has not reported licensing (an older agent, or no report yet). | The state is NO DATA. Update the agent, or wait for its first report. |
| no license installed | Reason: there is no license and no trial. |
| the license is bound to another host | Reason: the license was issued for a different install id. |
| the host identity changed: a new activation request is needed | Reason: send a new activation request to the vendor. |
| the agent has not reached the license server in time | Reason: the online check is late. Check that the host can reach the license server. |
| stage 1 of the trial is over: enter a work email to extend the trial to 30 days | Reason: see The trial. |
| the trial is over | Reason: install a purchased license. |
| No features granted. / No seats. | The license grants nothing of this kind, or there is no license. |
| Every configured job is allowed. | No job would stop. |
| Could not read the license state | The console could not read the report of this server. |
Other reasons are possible, for example “the license file was removed; there is no new trial after a license” or “the license is signed with a trial key but is not a valid trial license”.
Install a license
The section under the server details installs or uploads a license file. Choose the file in License file and click the button. What happens depends on where the agent runs:
| Agent | What the button does | Who may use it |
|---|---|---|
| On the machine of this console (local mode). Section title: Install a license in the agent on this machine. | Install sends the file to the agent. The agent checks the signature before it writes anything. | An administrator. In single-user mode this is the one user. |
| Elsewhere, and the console is set up for goafts. Section title: Upload a license to goafts. | Upload stores the file in goafts. Then click Assign to SRV in the list of Licenses in goafts, or Set as default. | A user with May push configuration to agents (users mode multiple). Administrators also need this right. Only an administrator sets the default license. |
If the agent or goafts refuses the file, the page shows their message. Every install, upload and assignment is written to the audit file, with a hash of the file and not the file itself. A change in goafts that cannot be written to the audit file is not made.
Activation request. In local mode, an administrator also sees
Activation request. It downloads license_request_<server>.json. Send it to
the vendor. The vendor binds a license to the install id in it. Install the
license you get back with the same page. Use this for a server that cannot
reach the license server.
Messages you may see
| Message | What it means |
|---|---|
| License accepted | The agent or goafts accepted the file. |
| Choose a license file first. | You clicked the button with no file chosen. |
| The file is over 1 MB: this is not a license. | You chose a wrong file. |
| This account cannot change licenses here: installing a license needs an administrator account | Local mode, and your account is not an administrator. The file field and the button are hidden. |
| This account cannot change licenses here: this console cannot deliver a license to this server: … | The agent is not on this machine (agent_config_path), and delivery through goafts is not set up. Install the license on that server. |
| The license is uploaded to goafts and is not tied to SRV: assign it to servers in the list below. | Remote mode. After the upload, assign the license in the list of licenses in goafts. |
| this agent has no license support: update the agent first (…) | The agent is too old for licenses. |
Licenses in goafts
This list shows the licenses that goafts stores. It is shown only when the
console is set up for configuration delivery (goafts_push_enabled and the
goafts_admin_* keys, users mode multiple), and your account is an
administrator or has May push configuration to agents.
The title line has Refresh and, for an administrator when goafts has a default license, Clear default license.
| Column | What it shows |
|---|---|
| License | The license id. The label default marks the default license. The label assigned here marks the license of the open server. A number in brackets, for example (3), shows to how many agents the license is assigned. |
| Customer | The customer of the license. |
| Valid until | The expiry date. |
| Seats used / total | For each kind of seat: how many are used and how many the license has. |
| State | The state badge of the license. |
| Actions | Assign to SRV or Unassign from SRV for the open server (a server whose agent is elsewhere), and Set as default (administrators only). |
The default license applies to every agent of this goafts that has no license of its own.
Messages you may see
| Message | What it means |
|---|---|
| No licenses are stored in goafts. | Upload a license first. |
| Assignments saved | goafts saved the change. |
| Make … the default license? It applies to every agent of this goafts that has no license of its own. | Confirm Set as default. |
| Clear the default license? Agents with no license of their own will have none. | Confirm Clear default license. |
| the default license applies to every agent of goafts; only an administrator may change it | Your account is not an administrator. |
| this change cannot be recorded in the audit trail, so it was not made: … | The console cannot write its audit file. Check audit_file. |
The trial
A new agent runs a trial in two stages:

- Stage 1: the first 7 days from the first start. No email is needed.
- Stage 2: you enter a work email, the vendor’s trial server mails you a code, and you enter the code. The trial then lasts 30 days from the first start.
- After the trial, with no license and enforcement on, the agent stops backups, restore, sweep, tracing, statistics and replication. The databases keep working.
The server’s details show the trial stage, the end of stage 1, the latest end of the trial (with the days left) and the state of the email request.
Extend the trial (local mode, administrator). The section Extend the trial to 30 days is shown for a server with no purchased license that has trial data.
- Enter the address in Work email.
- Tick the consent box. It says where the address goes and how long it is kept.
- Click Send. The page shows the answer of the trial server, or “The request is sent.”
- When the email arrives, enter the 6-digit code in Code from the email and click Confirm.
The agent installs the trial license by itself when the vendor has signed it. A line “Request: …” shows the state of the request.
For a server whose agent is elsewhere, the page only shows the trial. Enter the
email on that server, in its own console or with fbagent --trial-email.
Both steps are written to the audit file. The audit line of the email carries a hash of the address, not the address. The code is never written.
Messages you may see
| Message | What it means |
|---|---|
| Only an administrator can send the email and the code. | Local mode, and your account is not an administrator. |
| This page only shows the trial of this server. To extend it, enter the email on that server: in HQbird Monitor on that machine, or with fbagent –trial-email. | The agent is not on this machine. |
| The agent has no trial server set (license.trial_server in agent_config.json), so no email can be sent from here. | Set license.trial_server in the agent configuration. |
| This is not a valid email address. / Tick the consent box first. | Correct the form and click Send again. |
| Enter the 6-digit code from the email. | The code field is empty. |
| Wrong code. Attempts left: 2. | The code does not match. Check the email. |
| The request is closed: … | The request ended, for example “too many wrong codes” or “this server already had a trial”. |
| No trial is possible for this server: it already has a license, or 30 days since the first start have passed. | The trial cannot be extended. |
| The agent cannot reach the trial server. Check that this host can open HTTPS connections to it. | A network problem on the agent’s host. |
| The code is accepted. The agent installs the trial license by itself when the vendor has signed it. | Wait. The state changes to trial license installed. |
| The trial is over. Only a purchased license brings back the stopped work. | Install a purchased license. |
The license banner
Every page shows a banner under the header, for the servers you may see:
- red: “No license. Backups, restore, sweep, tracing, statistics and replication are stopped. The databases work.” A server has no license and enforcement is on. The link is License page.
- yellow: “Trial: 5 days left. To extend it to 30 days, enter a work email.” A server is in stage 1 of the trial and has 7 days or fewer left. The link is Enter an email.
Each line ends with “Servers: …” and up to 3 server names, then “and 4 more” when there are more. With one server the link opens that server on the License page. With several servers it opens the list. Enter an email goes to the trial section of the License page and puts the cursor in the email field.
A server whose last report is more than three days old is left out of the banner.
11. Administration: users and clusters
The Users and Clusters pages are for administrators only. The Servers page
shows the User management and Clusters buttons only to an
administrator in multiple mode. Another account that opens these pages gets
“Forbidden”.
Users
The console has two user modes. The administrator sets the mode in
config.properties (users_mode).
- single (default): one shared account. Its password is in the local
agent’s
agent_config.json(fbagent 2.80.0 or newer) or inaccess.properties. This user can do everything. There is no user management. The password is changed on the Settings page (see Settings). - multiple: several accounts, each with its own password and server list.
The accounts are kept in
users.enc.
In multiple mode, open User management on the Servers page.
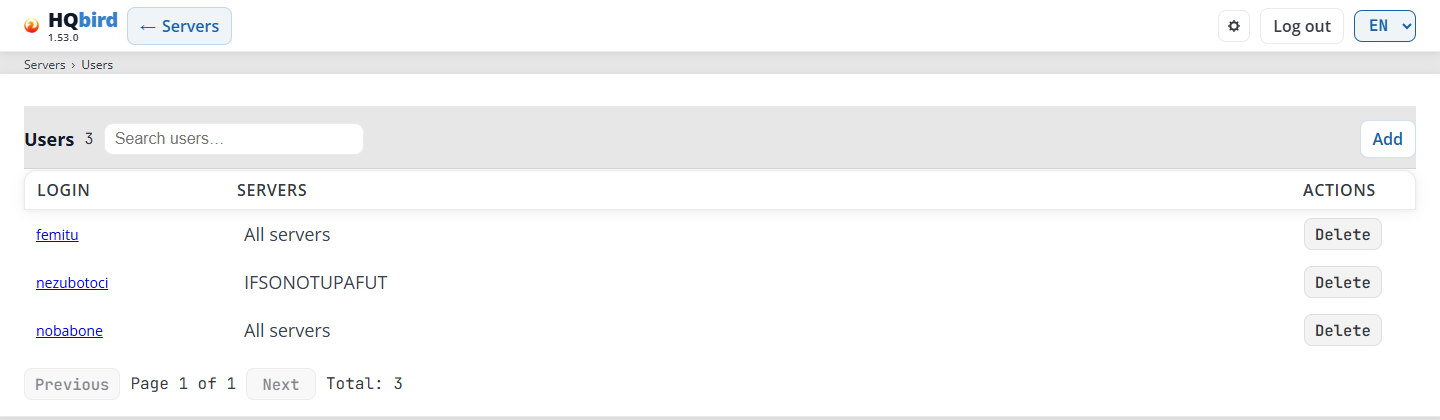
What you see
- The header with ← Servers, and the breadcrumb line
Servers › Users. - The title Users with the number of users, the search field Search users…, and the Add button on the right.
- The table of users.
- The paging line: Previous, “Page 1 of 1”, Next, and “Total: 3”.
| Column | What it shows |
|---|---|
| Login | The login. Click it to edit the user. |
| Servers | All servers for an administrator. For a user: the names of the assigned servers, or “—” when there are none. |
| Actions | Delete removes the user after you confirm. |
Messages you may see
| Message | What it means |
|---|---|
| Delete user …? | Confirm the delete. |
| Failed to delete user: cannot remove last administrator | The console must keep at least one administrator. |
| Failed to load users: … | The console cannot read users.enc. |
Tips:
- The search finds logins that contain the text. The list updates after a short pause and goes back to page 1.
- The table shows 50 users on a page.
Add or edit a user
Add opens the form for a new user:
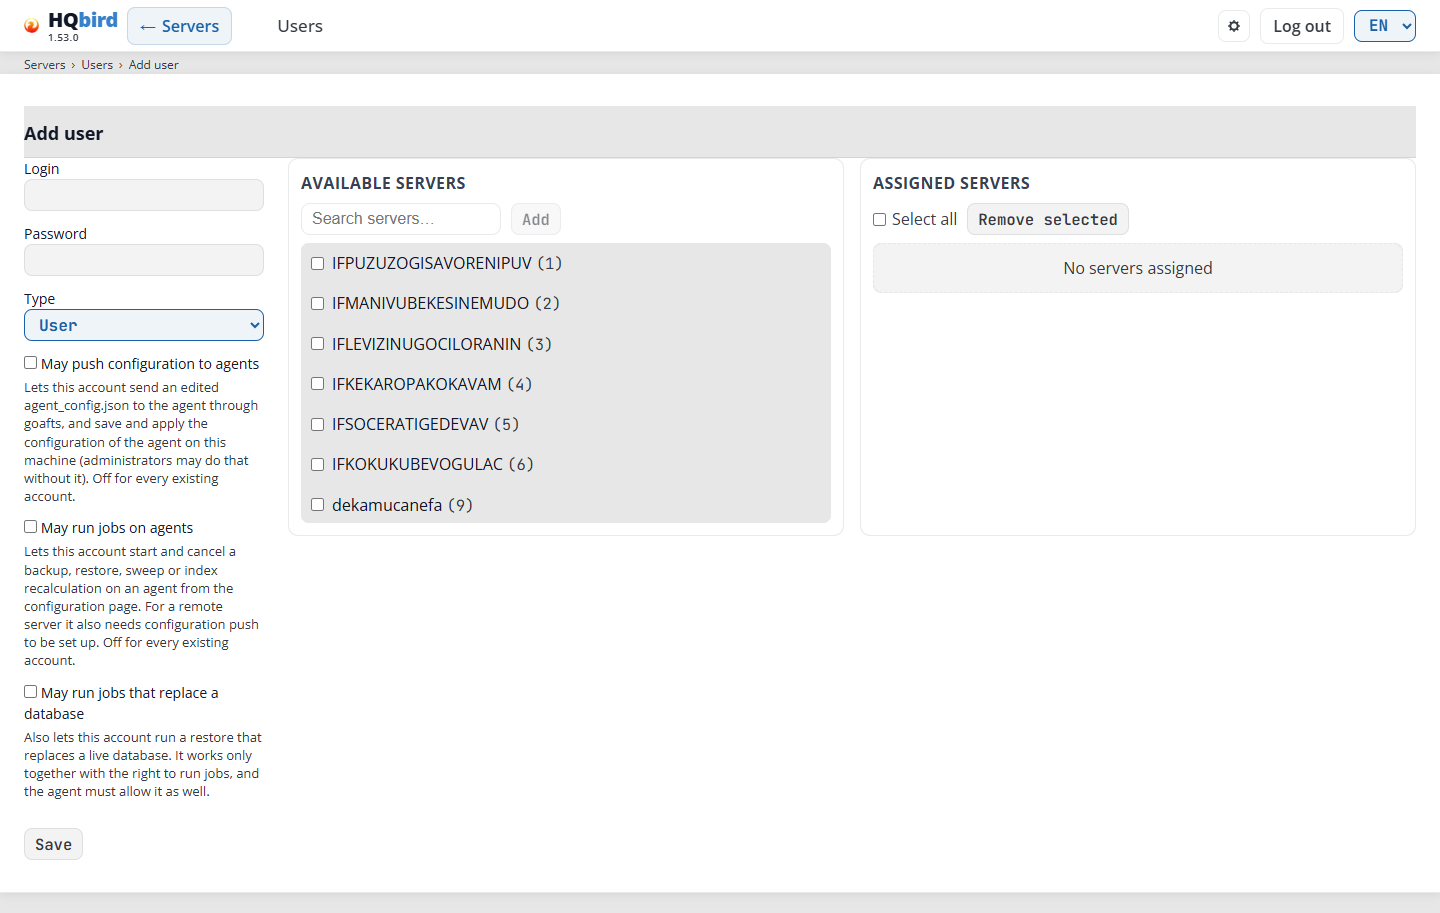
What you see
- The header with ← Servers and a Users link, and the breadcrumb line
Servers › Users › Add user. - The title Add user.
- On the left: Login, Password, Type, the three rights with their help texts, and Save.
- In the middle: Available servers, with the search field Search servers…, the Add button, the Select all filtered box (only while you search), and the servers as “name (id)”.
- On the right: Assigned servers, with the Select all box and the Remove selected button. With no servers it shows “No servers assigned”.
| Field | What it does |
|---|---|
| Login | The name to sign in with. |
| Password | The password. On the edit page, leave it empty to keep the current password (“Leave blank to keep the current password”). |
| Type | User (default) sees only its Assigned servers. Administrator sees all servers and manages users and clusters. For an administrator the server panels are hidden, and the form shows “All servers”. |
| May push configuration to agents | “Lets this account send an edited agent_config.json to the agent through goafts, and save and apply the configuration of the agent on this machine (administrators may do that without it).” |
| May run jobs on agents | “Lets this account start and cancel a backup, restore, sweep or index recalculation on an agent from the configuration page. For a remote server it also needs configuration push to be set up.” |
| May run jobs that replace a database | “Also lets this account run a restore that replaces a live database. It works only together with the right to run jobs, and the agent must allow it as well.” |
Every right is off for an existing account.
To add a user:
- Fill in Login and Password.
- Choose the Type.
- Tick the rights the user needs.
- For a User: find servers in Available servers (type in Search servers…), tick them and click Add. Add is active only when a box is ticked. Select all filtered shows only while the search field has text. It ticks every server that matches the search. The servers move to Assigned servers. Tick servers there and click Remove selected to take them back.
- Click Save. The console opens the edit page of the new user.
To edit a user, click the login in the list. The edit page has the title
Edit user and the breadcrumb Servers › Users › <login>.
Messages you may see
| Message | What it means |
|---|---|
| User saved | The change is saved. |
| Failed to add user: duplicate login | A user with this login exists. |
| Failed to add user: invalid login / invalid password | The login or the password is not allowed. Use another one. |
| Failed to add user: maximum user count exceeded | The console holds up to 2000 users. |
| Failed to save user: user not found | Someone deleted this user. |
| Failed to save user: cannot remove last administrator | You tried to make the last administrator a User. |
| No available servers | Every server is assigned, or no server matches the search. |
When changes apply:
- The console reads
users.encon every request. A new server list, a new type or a new right applies at the user’s next page load. - A new password signs that user out in every browser.
- In single mode the one shared user can run jobs on the agent beside the console, but not on a remote agent.
On the first start in multiple mode the console creates the administrator
admin7 with a random password. The password is written once to the console
log, or, when the administrator set initial_admin_password_file, to that file
and not to the log. Sign in and change it.
Clusters
Clusters manages HQCluster replication groups: the members, the replication links and the members’ certificates. The console does not store the clusters itself. It edits them through the admin API of goafts or of RCM (see goafts mode and RCM mode).
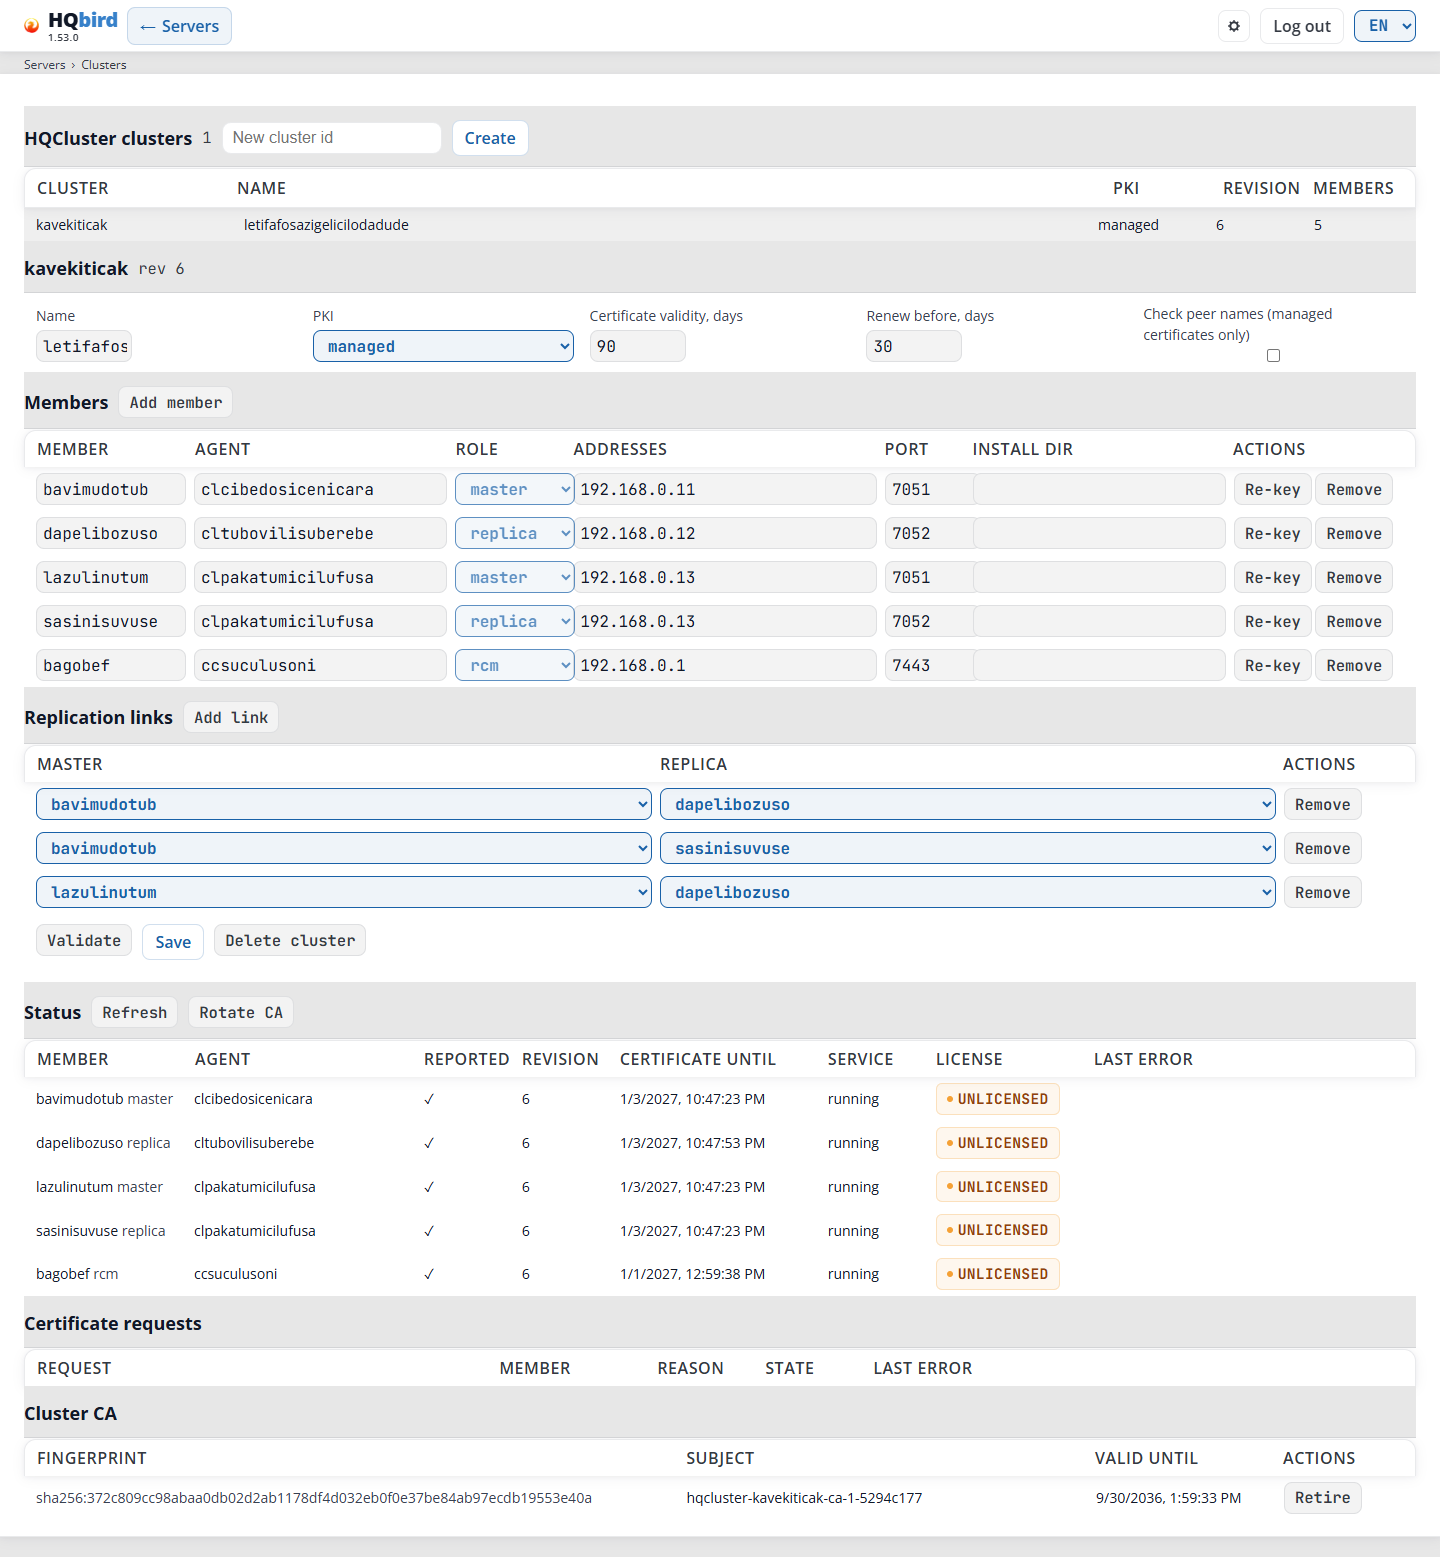
What you see
- The header with ← Servers, and the breadcrumb line
Servers › Clusters. - An error line. It is empty when all is well.
- The title HQCluster clusters with the number of clusters, the field New cluster id and the Create button.
- The list of clusters. Click a row to open the cluster.
- The open cluster: its id and its revision (
rev 6), then the cluster settings in one line. - Members with the Add member button, and the members table.
- Replication links with the Add link button, and the links table.
- The buttons Validate, Save and Delete cluster (not in RCM mode), and under them the list of errors and warnings.
- Status, Certificate requests and Cluster CA (see Cluster status and certificates).
| Column | What it shows |
|---|---|
| Cluster | The cluster id. |
| Name | The cluster name. |
| PKI | managed or external. |
| Revision | The revision of the stored cluster document. It grows with every save. |
| Members | The number of members. |
The cluster settings:
| Field | What it sets |
|---|---|
| Name | A name for people. |
| PKI | managed: the cluster’s own CA signs the member certificates, and the agents renew them. external: you manage the certificates yourself, and the agents only report them. |
| Certificate validity, days | How long a member certificate is valid: 2 to 825 days. Default 90. |
| Renew before, days | How many days before the expiry date the certificate is renewed. Default 30. |
| Check peer names (managed certificates only) | The members check the names in each other’s certificates. |
The members table:
| Column | What it shows |
|---|---|
| Member | The member id. |
| Agent | The agent of the host. The field offers the known agents as you type. |
| Role | master, replica, or rcm. |
| Addresses | The addresses of the member, separated by commas or spaces, for example 192.168.0.10. |
| Port | The replication port. A new member gets 7051. |
| Install dir | The install folder of the member. |
| Actions | Re-key (saved members only) orders a new key and certificate. Remove removes the member and its replication links. |
After a save, Member, Agent and Role of a member cannot be changed. To change them, remove the member and add it again. Changes in the members and links tables are stored only when you click Save.
The links table:
| Column | What it shows |
|---|---|
| Master | A member with the role master. |
| Replica | A member with the role replica. |
| Actions | Remove removes the link. |
To create or change a cluster:
- Enter a New cluster id and click Create. Or click an existing cluster to open it.
- Click Add member for each member. Fill in the agent, the role, the addresses and the port.
- Click Add link for each link from a master to a replica.
- Click Validate. The page shows “The document is valid.” or a list of errors (red) and warnings (amber).
- Click Save.
Messages you may see
| Message | What it means |
|---|---|
| A cluster id is lower-case letters, digits and “-”, up to 63 characters. | Change the id. It cannot start or end with “-”. |
| No clusters yet. | Create the first cluster. |
| The document is valid. | Validate found no problems. |
| A list of red and amber lines | Errors stop the save. Warnings do not. A refused Save shows its errors in the same list. |
| Cluster saved | The new revision is stored. |
| Someone else changed this cluster. Reload it and make your change again. | Another administrator saved the cluster after you opened it. |
| Delete cluster …? It must have no members. | Confirm Delete cluster. Remove all members and save first. |
| clusters are edited through … admin API, which this console is not set up for: … | The console settings for clusters are incomplete. See Troubleshooting. |
| this change cannot be recorded in the audit trail, so it was not made: … | Every change is written to the audit file first. Check audit_file. |
Cluster status and certificates
These parts are shown for a saved cluster.
Status shows what each member reports. Refresh reads it again. Rotate CA is shown only for a cluster with managed PKI.
| Column | What it shows |
|---|---|
| Member | The member id and its role. |
| Agent | The agent of the member. |
| Reported | ✓ when the member has reported, — when not. |
| Revision | The cluster revision the member applied. |
| Certificate until | The expiry date of the member certificate. renew due marks a certificate that is due for renewal. |
| Service | The state of the replication service, for example running. |
| License | The license state badge of the agent. Click it to open the server on the License page. |
| Last error | The last error of the member. |
Certificate requests shows the newest 20 requests, newest first.
| Column | What it shows |
|---|---|
| Request | The request id. |
| Member | The member that asked for a certificate. |
| Reason | Why the certificate was requested. |
| State | The state of the request. |
| Last error | Why the request was refused, if it was. |
Cluster CA lists the CA certificates that the members trust.
| Column | What it shows |
|---|---|
| Fingerprint | The SHA-256 fingerprint of the CA certificate. |
| Subject | The subject of the CA certificate. (retired) marks a CA that is no longer used. |
| Valid until | The expiry date of the CA certificate. |
| Actions | Retire removes the CA from the bundle that the members trust. |
Messages you may see
| Message | What it means |
|---|---|
| Rotate the CA of cluster …? Every member gets a new CA bundle and restarts once in its window. | Confirm Rotate CA. |
| Make a new key and certificate for …? | Confirm Re-key. |
| Remove this CA from the bundle the members trust? | Confirm Retire. |
| Order queued | The order is stored. The members carry it out. |
goafts mode and RCM mode
The page works with one of two backends. The key rcm_admin_url decides:
| goafts mode | RCM mode | |
|---|---|---|
| When | rcm_admin_url is empty (default). |
rcm_admin_url is set. |
| Settings | goafts_push_enabled=true, the five goafts_admin_* keys, and users_mode=multiple. |
rcm_admin_url, rcm_admin_user and rcm_admin_password_file. Users mode single or multiple. The goafts keys are not needed. |
| Where the console runs | Anywhere it can reach goafts. | On the RCM host: the console calls RCM’s operator port, usually http://127.0.0.1:7444. |
| Clusters | Many. | One at most. Create works only while RCM has no cluster. |
| Delete cluster | Deletes a cluster that has no members. | Not shown: RCM refuses a delete, because the cluster exists as long as RCM. |
| Agent suggestions | The servers this console sees. | The agents that joined RCM. Revoked agents are not offered. |
Everything else works the same in both modes: the editor, Validate, Save with the revision check, the status, the certificate requests, the cluster CA, Re-key, Rotate CA and Retire.
In RCM mode the console signs in to RCM as rcm_admin_user (HTTP Digest) and
sends the login of the console user with every change. In single mode the
Servers page does not show the Clusters button. Open /clusters directly.
12. Installation and settings for administrators
Install
- Beside an agent on Windows or Linux: use the install script. See the local-install documentation shipped with the product.
- Behind HTTPS with nginx: see the HTTPS deployment notes shipped with the product.
- The console needs no internet access. It serves its scripts, charts and fonts itself, so it also works on a closed network.
Settings file
The console reads one settings file. It looks for it in this order and uses the first file it finds:
- The file named in the environment variable
FBMONITOR_CONFIG_PATH. When this variable is set, the console looks nowhere else. fbmonitor.properties, thenconfig.properties, in the folder of the program file.fbmonitor.properties, thenconfig.properties, in the working folder.
The file config.example.properties lists every key with a comment. Lines
that start with # are comments. Most keys also have an environment variable
FBMONITOR_<KEY>, for example FBMONITOR_PORT. The variable overrides the
file. users_mode and draft_keep_days have no variable. A relative path in a
file key (for example audit_file or rcm_admin_password_file) is taken from
the folder of the settings file.
The most important keys:
| Key | Default | What it sets |
|---|---|---|
data_path |
none | The folder with the agents’ data. Required. |
port |
8080 |
The HTTP port. |
data_timezone |
none | The time zone of the data files when the agent does not report one. |
users_mode |
single |
single or multiple. |
initial_admin_password_file |
none | Where the password of the first administrator goes when multiple mode creates users.enc. Without it the password is printed once to the log. |
access_properties_path |
none | The path to access.properties for single mode. Used when the agent’s agent_config.json has no sign-in. |
agent_config_path |
none | The live agent_config.json of the local agent. Turns on local mode, and holds the single mode sign-in (fbagent 2.80.0 or newer). |
bind_address, behind_proxy |
all interfaces, false |
Use 127.0.0.1 and true when nginx is in front of the console. |
require_https_for_secrets |
false |
false: you can enter a Firebird password in the configuration editor over plain HTTP, and a warning says the connection is not encrypted. true: the password field stays read-only until the request comes over HTTPS. |
goafts_push_enabled, goafts_admin_* |
false, none |
Configuration delivery to remote agents. The five goafts_admin_* keys are the URL, the client certificate, its key, the CA and the token file. |
goafts_server_list |
true |
When the five goafts_admin_* keys are set, the Servers page takes its rows from the server list of goafts and does not read every server folder. It reads the folders when the list is not usable. false: always read the folders. |
config_drift_minutes |
10 |
After how many minutes with no answer from the agent the delivery status shows DRIFT (see Delivery status). 0 or a wrong value means 10. |
draft_keep_days |
30 |
How many days the console keeps old drafts of agent configuration (applied or out of date). 0 keeps all. |
rcm_admin_url, rcm_admin_user, rcm_admin_password_file |
none | The Clusters page through RCM’s admin API, without goafts (see goafts mode and RCM mode). |
chatwoot_enabled, chatwoot_*, support_email |
false |
The support chat on the server screen: a bubble in the bottom right corner that opens a chat window. |
audit_file |
hqmonitor_audit.log next to the settings file |
The audit log. |
The key refresh_interval_sec is no longer used. The console ignores it and
writes a warning to its log.
Restart the console after you change the file. A restart signs out all users.
Some files are read again each time they are used, so a change needs no restart:
goafts_admin_token_file: read at each call to goafts. You can rotate the token while the console runs.rcm_admin_password_file: read at each request of the Clusters page. The line break at the end is ignored.users.encinmultiplemode: read on every request.
Sign-in cookie
The console keeps the sign-in in the cookie fbmonitor_auth_<port>, for
example fbmonitor_auth_8080. The name comes from the key port. A browser
keeps cookies per host and not per port, so the port in the name lets two
consoles on one host keep separate sign-ins.
- The sign-in lasts 7 days.
- The console makes a new signing key at every start. A restart signs out all users.
- In
multiplemode a new password for an account signs out that account in every browser.
The data folder
The console reads the folder in data_path. There is one folder per server,
named after the agent. Inside:
| Folder | Used for |
|---|---|
server_level/cpuram |
CPU, load and memory charts |
server_level/GetActiveDatabases |
Connections and databases |
server_level/diskspace, firebird_files |
Disk space and temporary files |
server_level/diskio |
Disk latency and throughput (agent task collect_disk_io) |
server_level/log_files |
Logs page |
server_level/statuses, aireport |
Status column and health report |
server_level/perfreport |
Perf Report and the Queries tab |
server_level/tracesummary, traceperminute, lwmmon |
Top queries, Errors page, Connections tables |
server_level/conflict_reports, conf_changes |
Conflicts and Configs pages |
server_level/agent_config |
Configuration editor in remote mode |
<database>/DatabaseMetrics |
Database charts |
<database>/AdvancedDbStats, ClientVersions |
Metrics and Clients Versions pages |
<database>/*_gstat_full.log |
Statistics page |
13. Troubleshooting
I cannot sign in.
Check the message on the sign-in page. If it names access.properties or
users.enc, the administrator must fix the console settings. In single
mode with fbagent 2.80.0 or newer, the administrator can set a new password
on the agent’s host with fbagent --reset-hqmonitor-password. All open
sessions then end.
I was signed out. The console was restarted, or an administrator gave your account a new password. Sign in again.
A server is not in the list.
In multiple mode, ask the administrator to assign the server to you. If you
are an administrator, check that the agent writes data to data_path.
The charts are empty. Choose another date with Choose date. Only days with data can be selected. If no day can be selected, the agent has not sent data yet.
The data is old. Press F5. The pages do not refresh by themselves. If the time under the status on the Servers page stays old, check the agent on that server.
The times look wrong. The console shows the server’s time zone. Check the zone badge near the time controls.
The Jobs and Backups links are missing. The agent has not sent its configuration yet. Older agents do not send it.
The Backups page is empty. The agent has not recorded a backup yet. The inventory fills in as backups run, and fully at the next backup status check (every 2 hours).
The Queries tab is missing in a statistics report. No usable performance report ends within 23 hours of the snapshot. Check Perf Report for that day.
A job shows “gates differ”. The section flag and the scheduler task of the job do not agree, so the job does not run. Read the reason under the status word. It names the switch that is off, for example “section off” or “tick off”. Or use the fix on the Problems tab.
Save and Send to agent is missing. Delivery is turned off on this console, or your account does not have May push configuration to agents.
Run now is greyed out. Point at the button. The tooltip names the reason: your account lacks May run jobs on agents, the delivery settings are incomplete, the agent has remote commands switched off, or the agent is older than 2.61.0.
The status shows DRIFT.
The agent has not answered for 10 minutes or more after the change was sent
(the key config_drift_minutes sets this time). Check that the agent is
running and can reach goafts.
The Clusters page shows “clusters are edited through RCM’s admin API, which this console is not set up for: …”.
rcm_admin_url is set, but another RCM setting is missing. The end of the
message names it:
- “rcm_admin_user is not set”: add
rcm_admin_userand restart the console. - “rcm_admin_password_file is not set”: add the key and restart the console.
- “rcm_admin_password_file cannot be read: …” or “rcm_admin_password_file … holds no password”: fix the file. The console reads it on every request, so no restart is needed.
The Clusters page shows “clusters are edited through goafts’ admin API, which this console is not set up for: …”.
rcm_admin_url is empty, so the page uses goafts, and configuration delivery
is not set up. The end of the message names the missing setting, for example
“goafts_push_enabled is false, …” or “users_mode is not multiple, …”. Set up
delivery, or, on an RCM host without goafts, set the rcm_admin_* keys (see
goafts mode and RCM mode).
The License page shows NO DATA for a server. The agent of that server is older than the license support, or it has not written its first report yet. Update the agent or wait.